STOP Pattern Trading If You Want To Become Profitable
Key Takeaways
Most traders don't lose money because they lack patterns (breakers, inversion fair value gaps, order blocks, OTE, silver bullet, etc.) — they lose because they treat every pattern as equally valid. The fix isn't learning more concepts; it's removing low-quality setups using two filters:
- A pattern is just a pattern. Breakers, inversion FVGs, and order blocks are visual shapes — they are not inherently high or low probability on their own.
-
Grade every setup with two filters before entering:
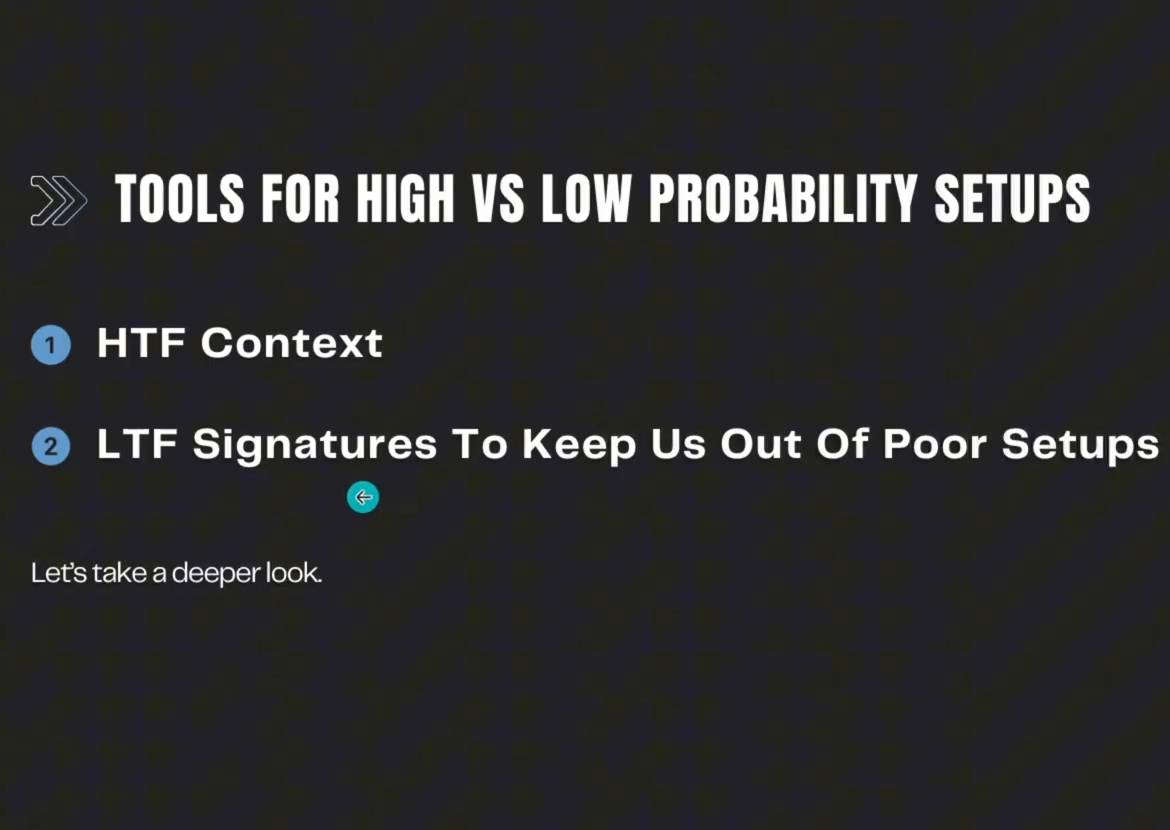
- HTF Context: drawn liquidity + trend, premium/discount positioning, and clear manipulation (a real sweep).
- LTF Signature check: does the stop-loss fall just short of a key opening price, session high/low, EQ level, or (previous) opening gap?
- If the stop-loss is "just short" of a key level, skip the trade. That level is a magnet and will likely be run first, stopping you out before any real move.
- The same chart pattern can appear twice in one session — once as a trap (stop short of a key level) and once as the real, high-quality version (after that key level has actually been swept/delivered to). Learn to tell them apart rather than reacting to the first occurrence.
- Trade during macro windows (e.g., :50–:10 each hour) when possible, to further stack probability.
- Less is more. Removing low-quality setups — not adding more concepts, more leverage, or more screen time — is what improves consistency and protects the equity curve.
- Being wrong on a high-quality setup is fine (it's still a probability game); the goal is to eliminate the easily avoidable losing trades caused by poor stop-loss placement relative to key levels.
Quick-Reference Checklist (Use Before Every Entry)
The lecture's central lesson is selectivity: look for a high-probability combination of context and execution conditions, rather than trading every lower-timeframe pattern.
Part 1 — The Framework
1.1 The Lower Timeframe Illusion
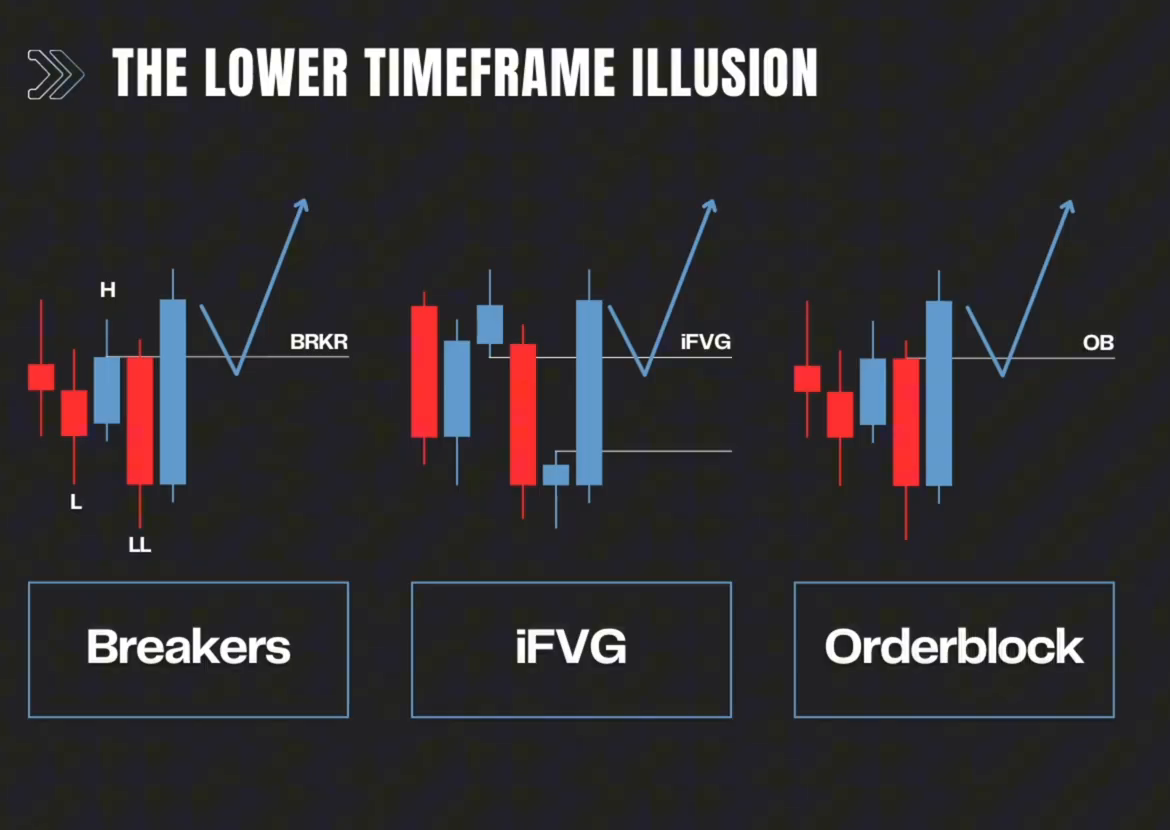
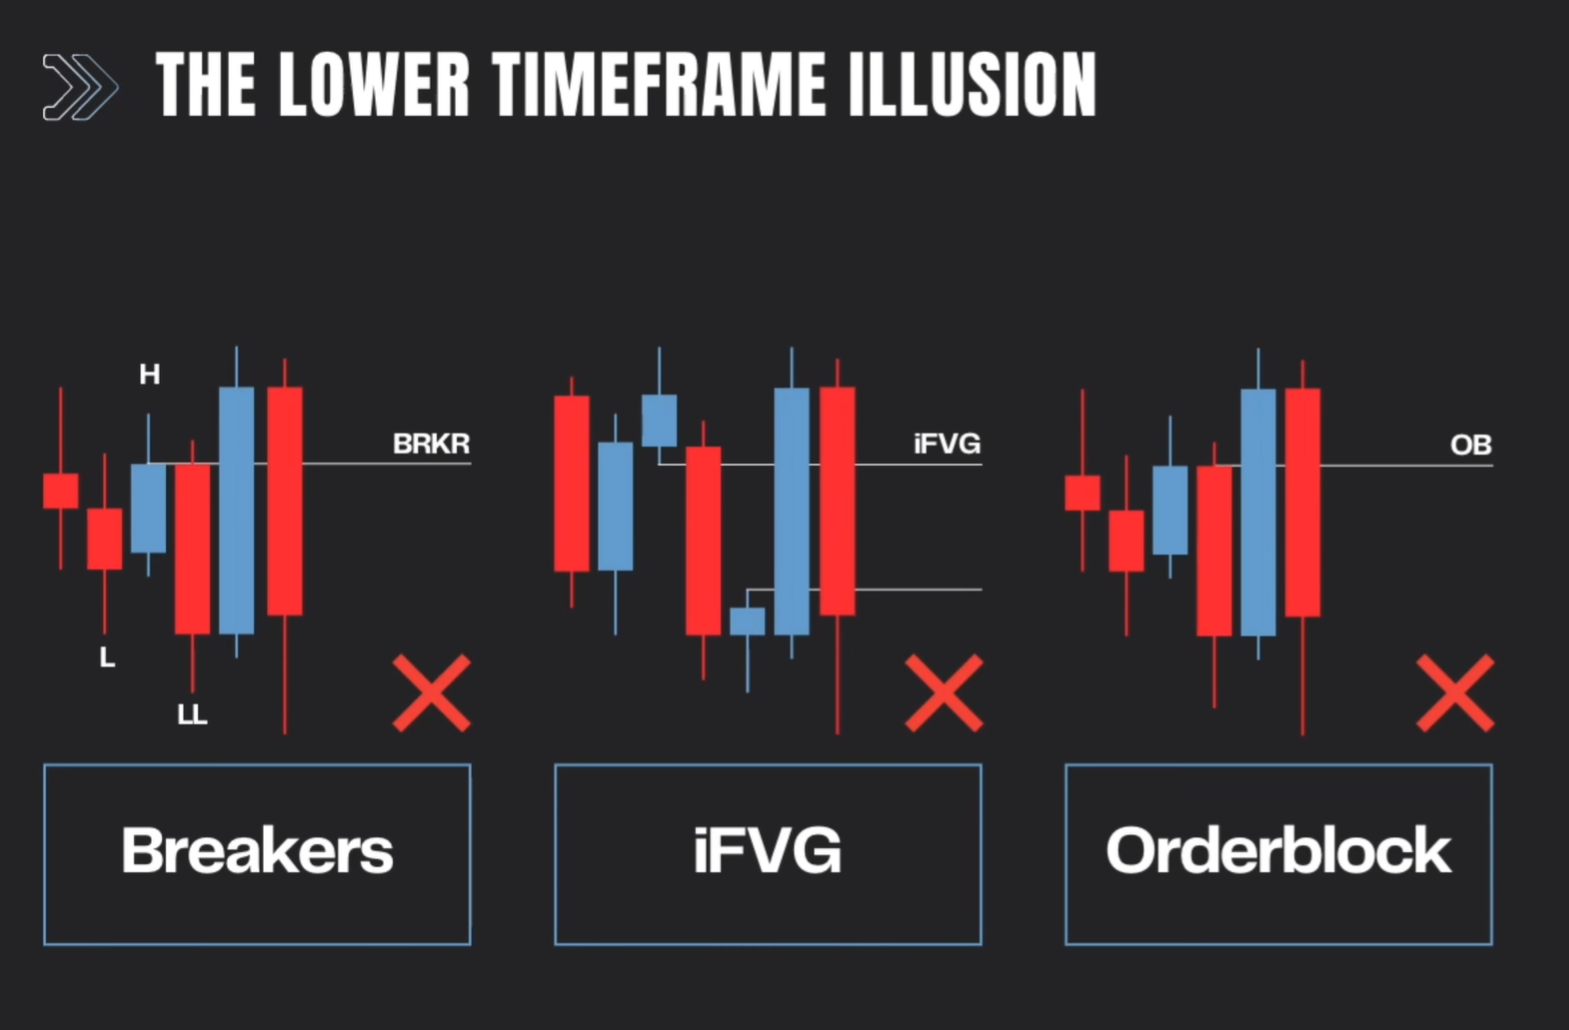
- On the 1-minute (or 5-minute) chart, it's easy to convince yourself a setup is valid at almost any time.
- Without hard rules, this leads to overtrading: a win keeps you glued to the charts, followed by losses trying to dig out of drawdown.
- The three most common ICT entry models used as examples throughout the video:
- Breaker: Low → High → Lower Low, close back above the breaker (bullish), enter long expecting higher prices.
- Inversion Fair Value Gap (IFVG): Sweep below a bearish FVG, close back above it (inverts it bullish), enter long.
- Order Block: "Change in state of delivery" — run the low, close above the last down-close candle, enter long.
- The problem: these patterns fail often enough to erode confidence — not because the concept is wrong, but because not every occurrence of the pattern is high probability.
1.2 Three Pillars Behind Today's Logic
| Pillar | Idea |
|---|---|
| 1. Trading is a game of probabilities | No trade is certain. Every entry carries risk — the goal is to stack probability in your favor. |
| 2. Every entry model is just a pattern | Breakers, IFVGs, order blocks — all are visual patterns, nothing more. They must be filtered, not blindly trusted. |
| 3. High-probability vs. low-probability pattern trades | The differentiating factor is context (HTF) and stop-loss placement (LTF) — not the pattern itself. |
1.3 Tool #1 — Higher Timeframe (HTF) Context
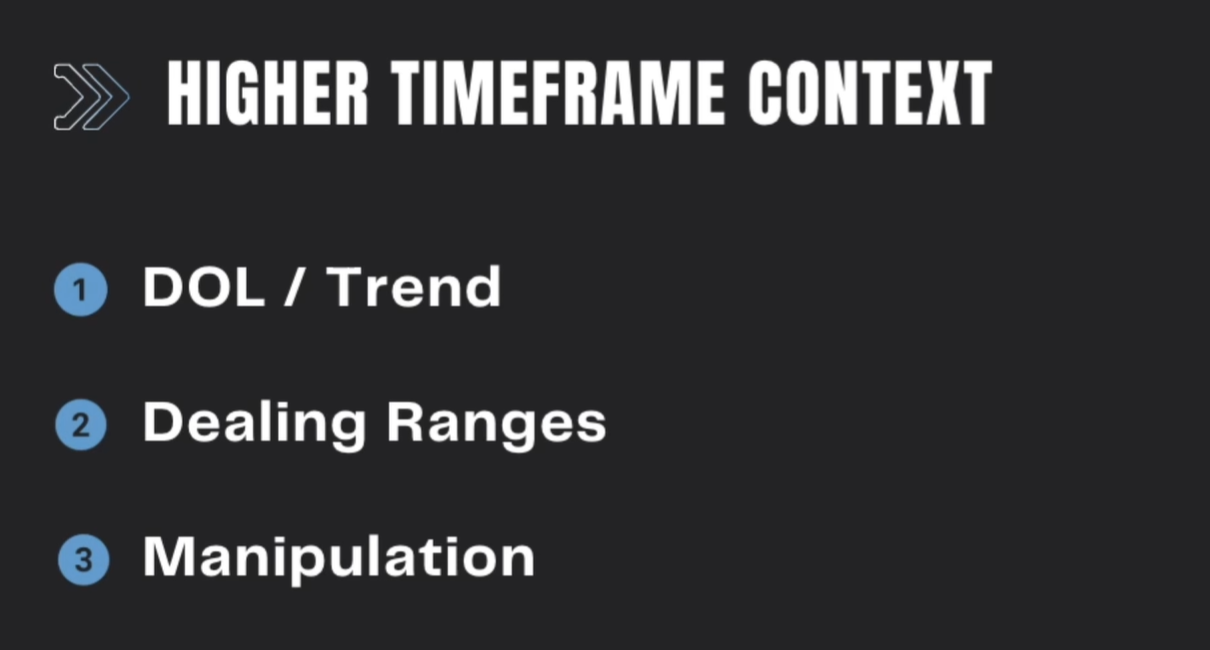
Three things to check, kept deliberately simple (no need for 50 timeframes or obscure concepts):
- Drawn liquidity — Are highs/lows smooth? What's the obvious trend?
- Dealing ranges (premium/discount) — Is price trading in premium or discount relative to the higher-timeframe range?
- Manipulation — Is there a clear sweep in the opposite direction before the entry pattern forms? (E.g., bullish bias requires a sweep to the downside first.)
1.4 Tool #2 — Lower Timeframe (LTF) Signatures
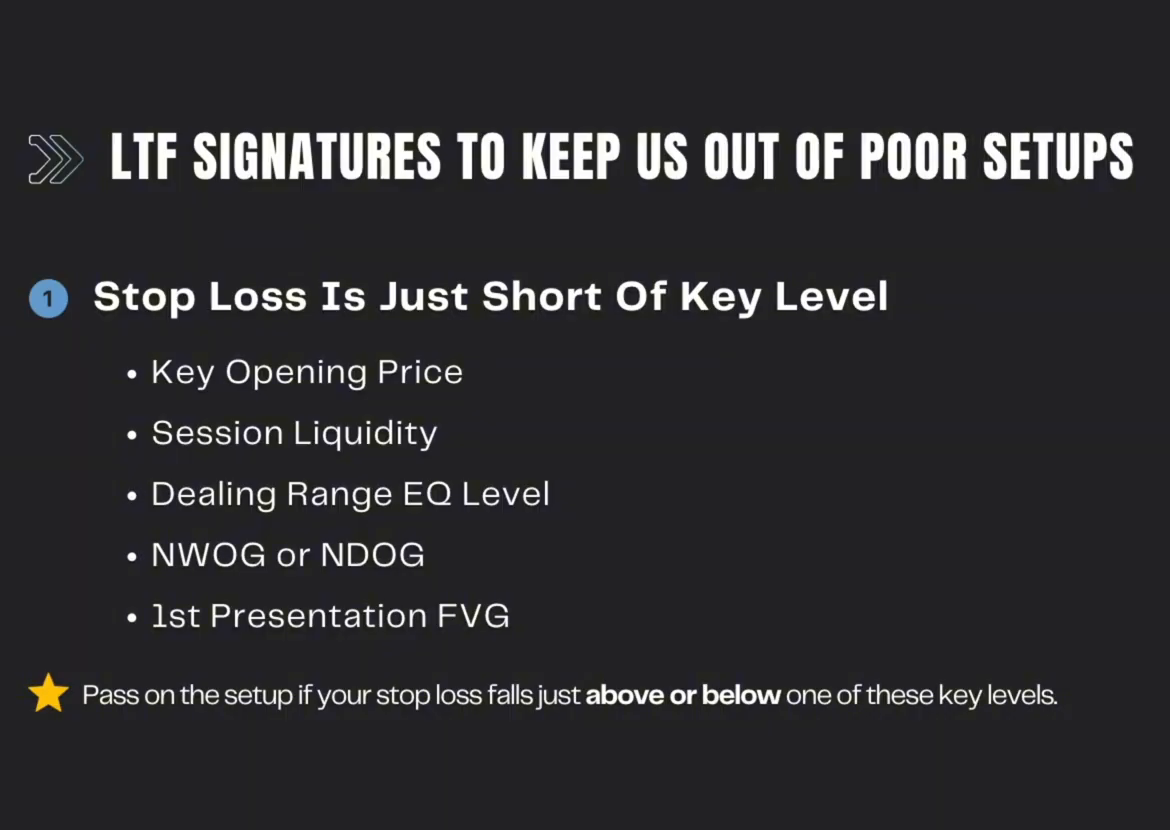
Key levels to check against your stop-loss:
- Key opening prices: weekly open, midnight open, 9:30 open, macro open.
- Session liquidity: session highs/lows (e.g., London Killzone high/low 02:00–05:00 ET, NY opening range 9:30–10:00 ET, full AM session high/low 9:30–16:00 ET, lunch, etc.).
- Dealing range EQ (equilibrium) level:
- New Day Opening Gap (NDOG) — including previous days' NDOGs, not just the current day's.
- First Presentation Fair Value Gap (e.g., the 9:30 FVG).
Rule of thumb: If your stop-loss sits just short of any of the above levels, price is very likely (Tim estimates roughly 8–9 times out of 10) to run through that level and stop you out before the "real" move happens. This single filter is described as one of the most powerful tools for cutting easily avoidable losing trades from your system.
1.5 The Ideal Scenario (All Four Must Align)
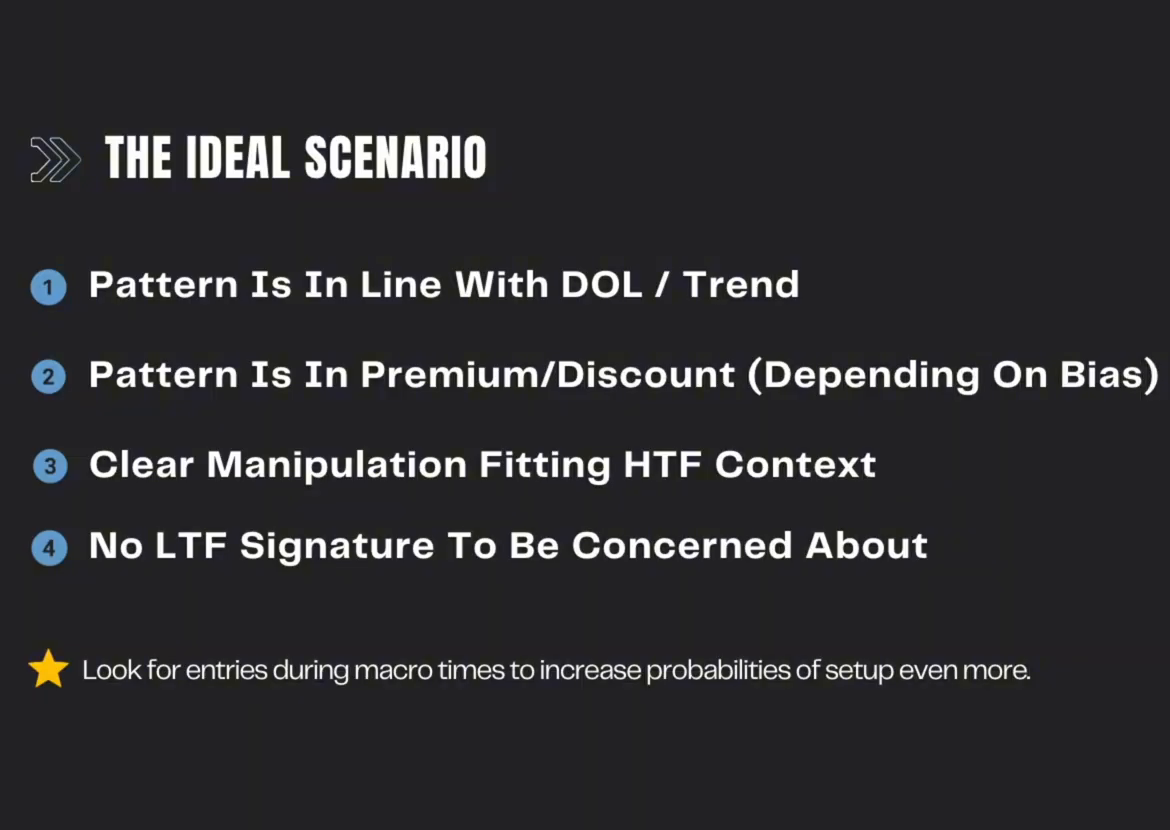
- Pattern (breaker / IFVG / order block) is in line with drawn liquidity and the overarching trend.
- Pattern occurs in the correct premium or discount relative to bias (shorts in premium, longs in discount).
- Clear manipulation fitting the higher-timeframe context (a real sweep of a session high/low or key opening price, not just "any" wick).
- No lower-timeframe signature to worry about — i.e., the stop-loss is not sitting just short of a key opening price, session liquidity, or EQ level.
Bonus filter: Look for entries occurring during macro windows (e.g., :50–:10 each hour) to further increase probability.
The "Hard Stop" (No-Trade) List
Refrain from execution if any of these binary filters are present:
- Magnet Proximity: The stop loss is placed just short of a session high/low or a key opening price (e.g., Midnight Open).
- Unmet 9:30 FVG: A 9:30 gap remains undelivered just beyond your entry or stop loss.
- EQ Violation: Your stop loss for a long is sitting just above the Dealing Range Equilibrium (EQ) rather than in a Deep Discount.
- Engineered Lows: The stop loss is sitting at "Relative Equal Lows" that have not yet been swept.
Part 2 — Live Chart Examples (NASDAQ, 1-Minute Timeframe)
Example 1 — The Avoidable Short (July 27)
Clear expansion to the upside in the NY AM session. Traders see engineered sell-side liquidity and trendline liquidity and want to frame a bearish/short bias.
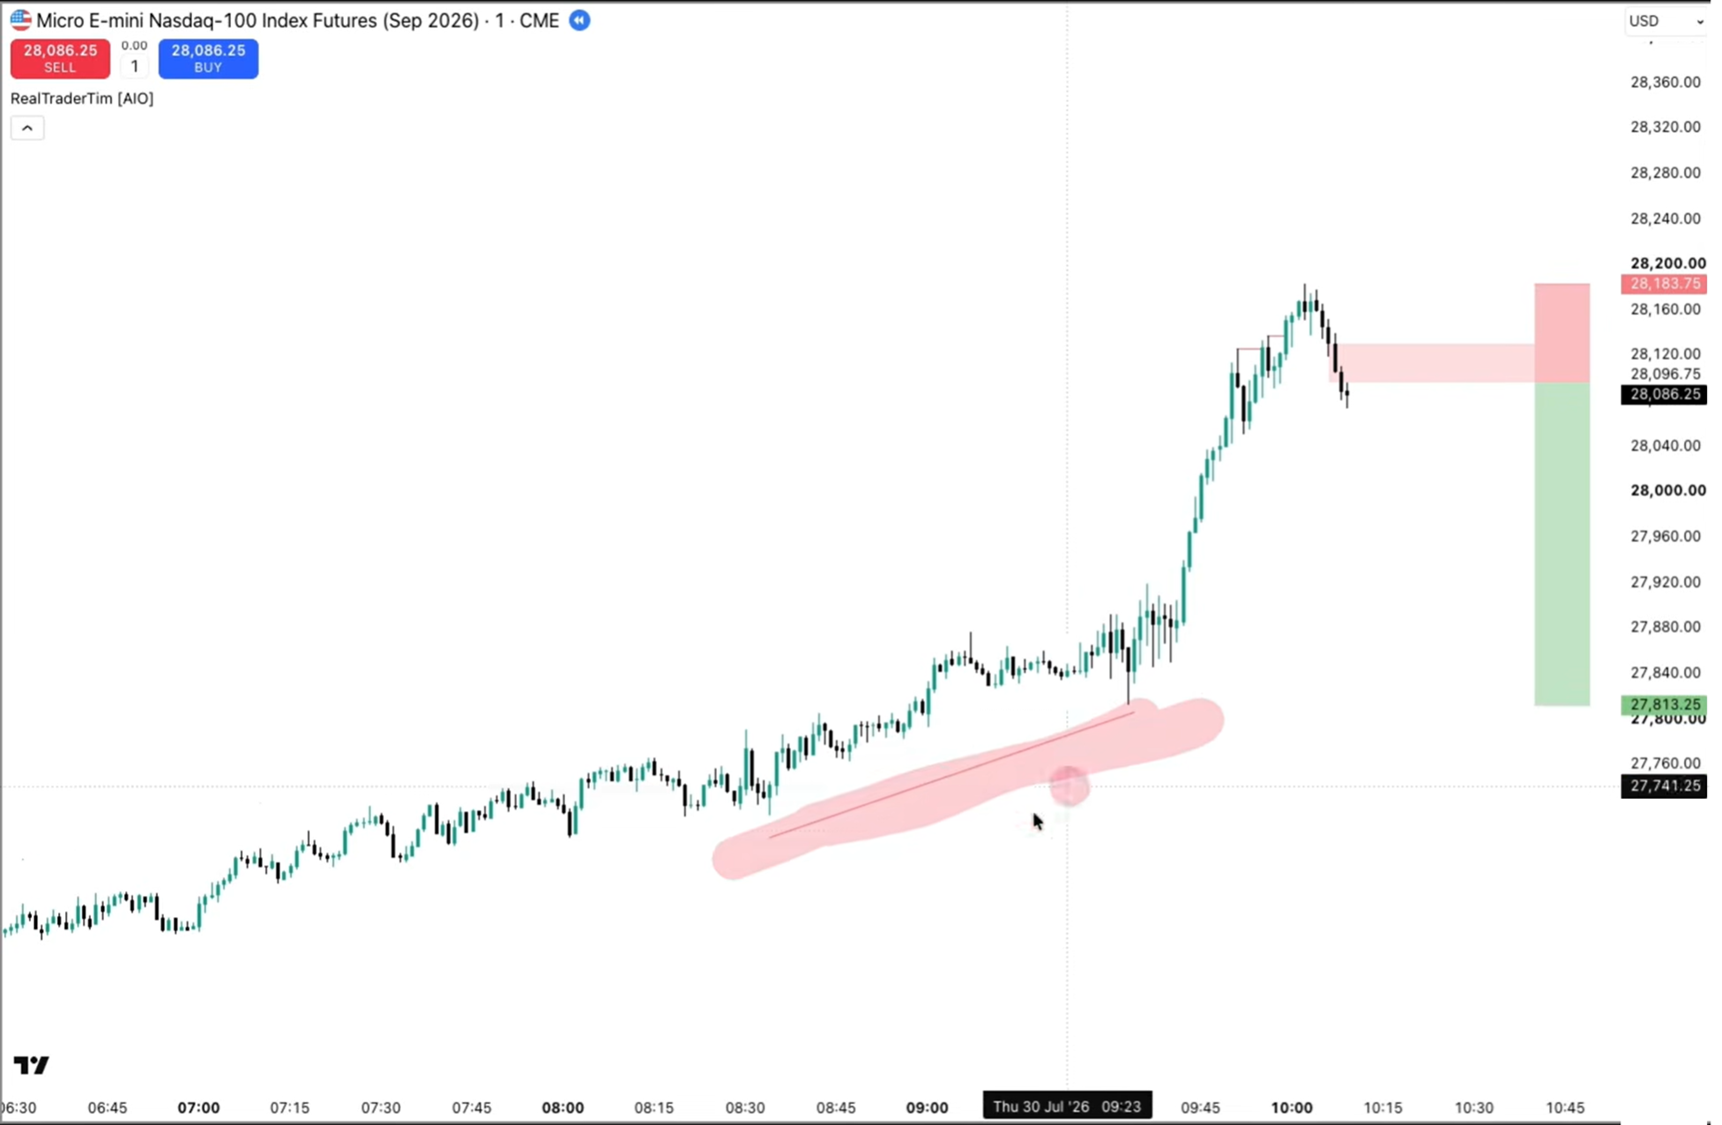
Zooming out to the 4-hour chart shows price is in a premium — seemingly supporting a short. But the intended stop-loss sits just short of a prominent swing high (28,177.25).
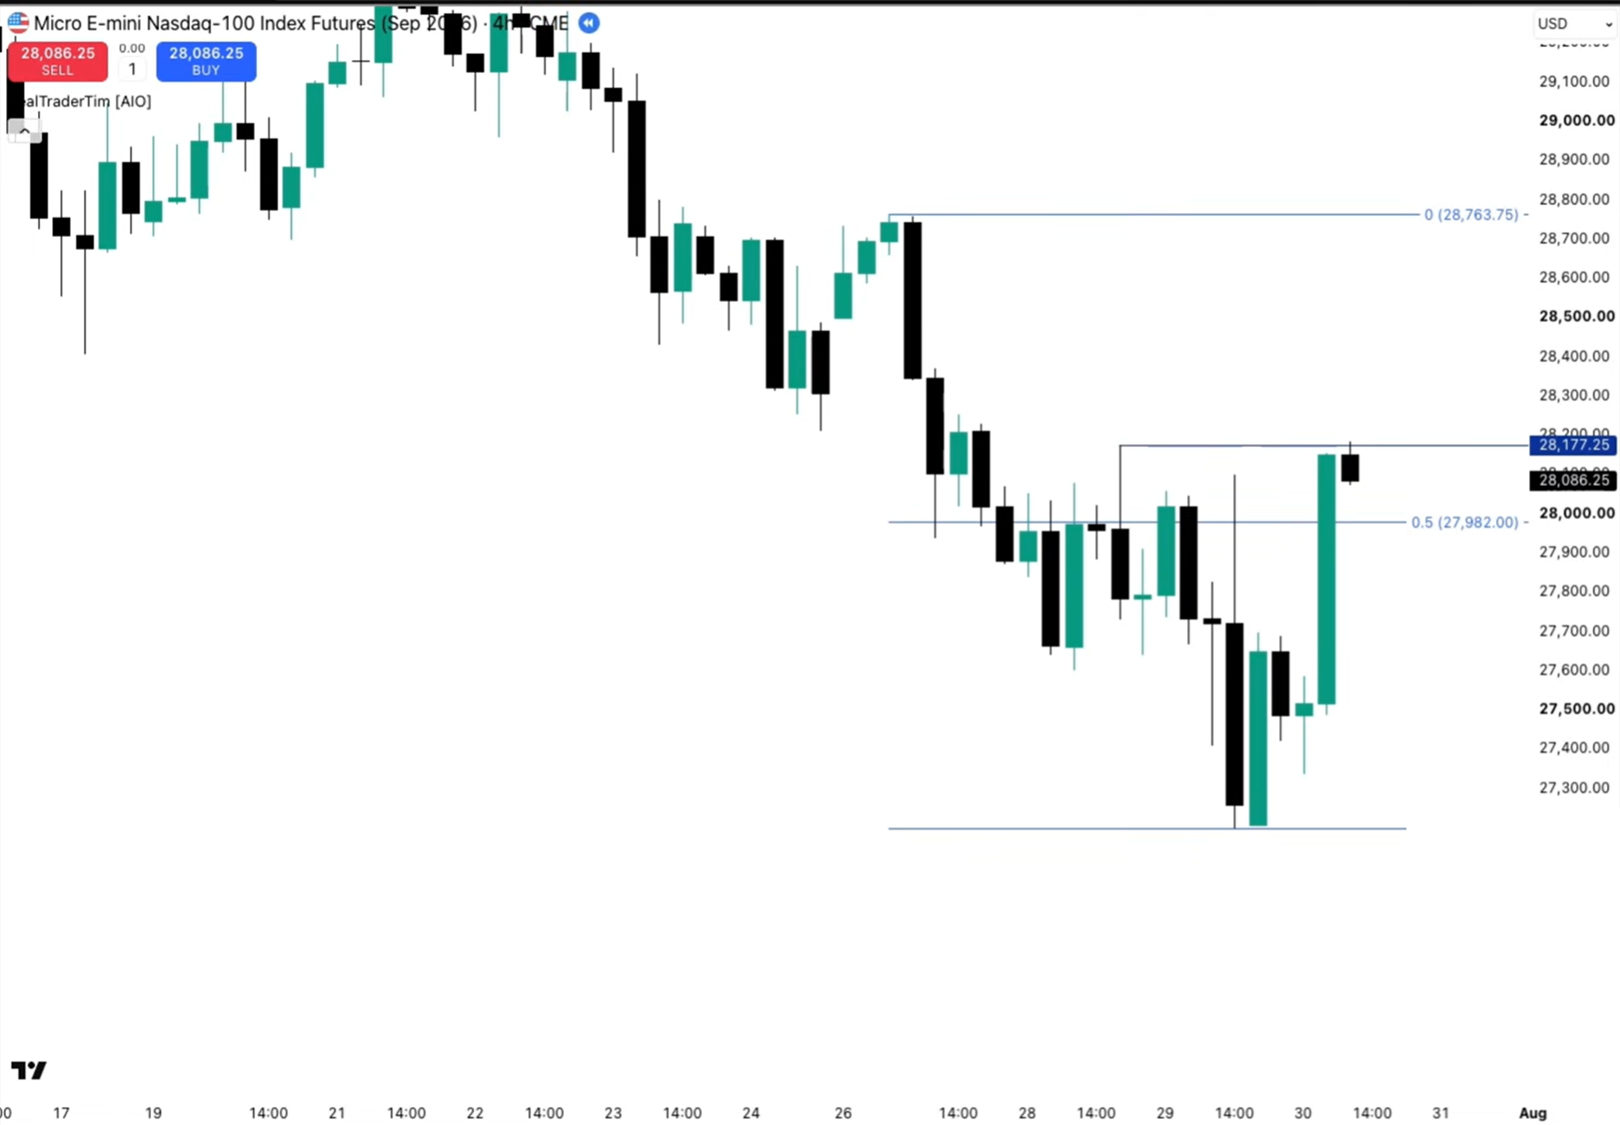
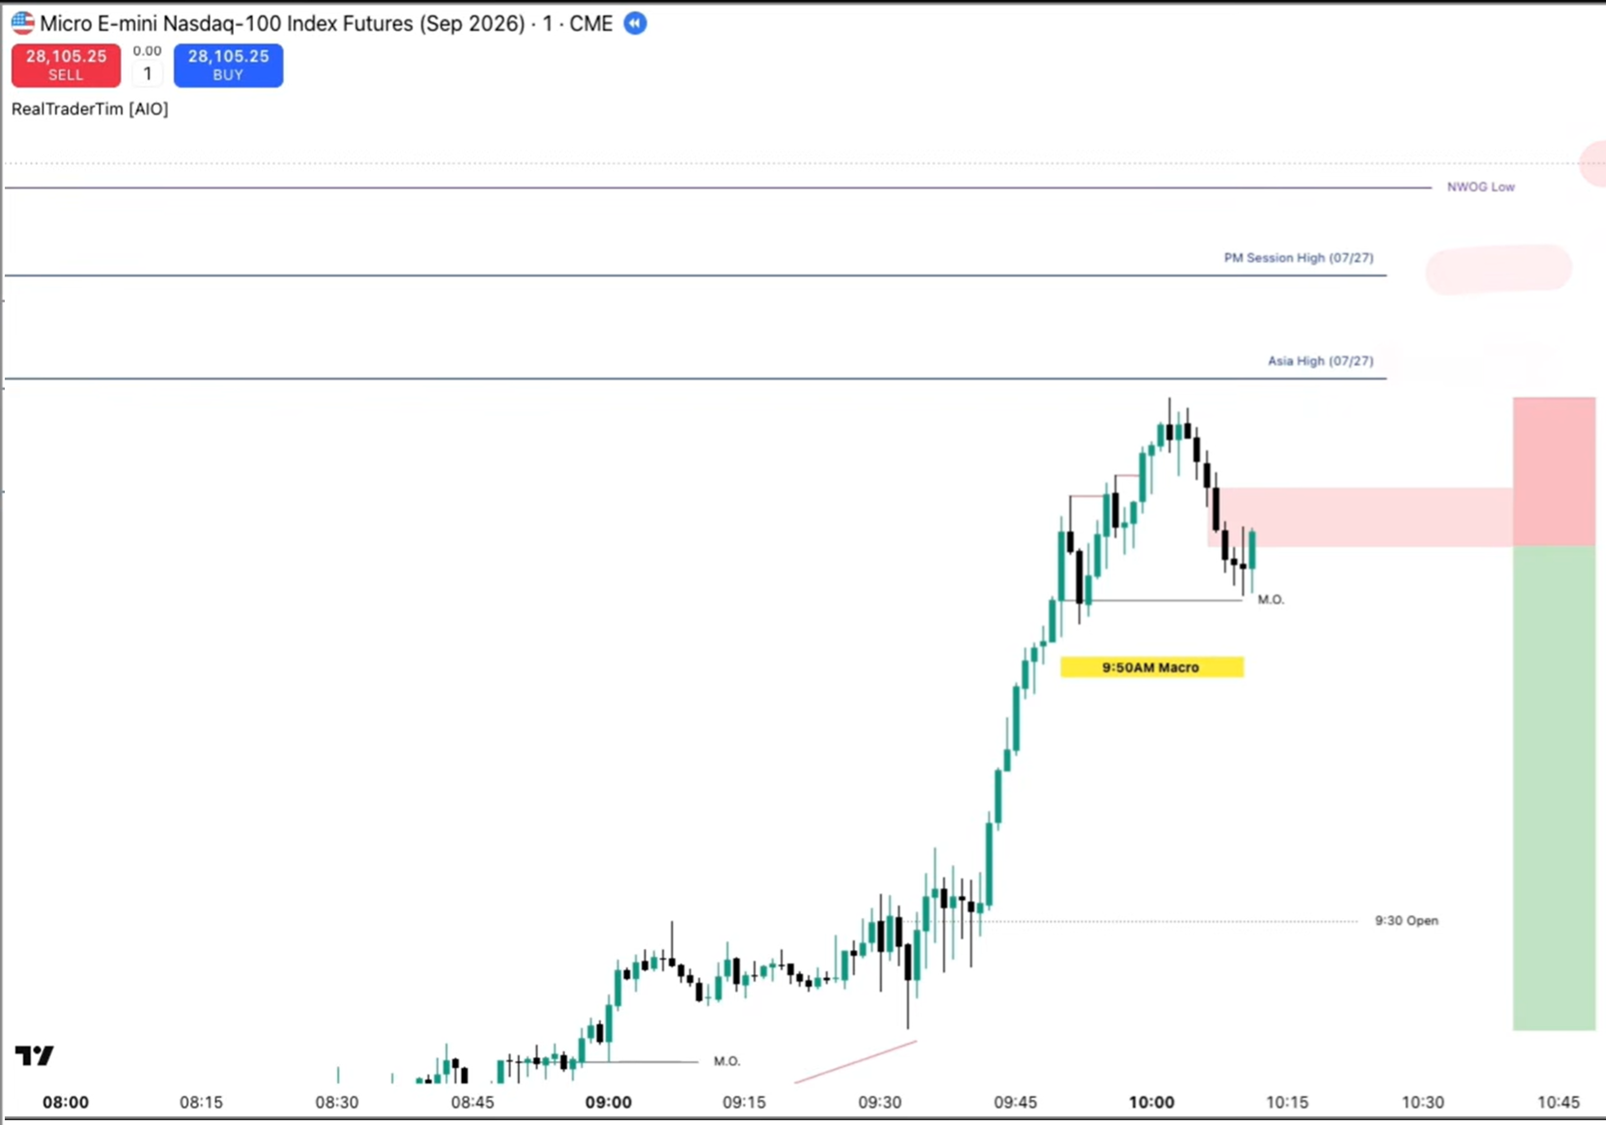
Zooming back to the 1-minute chart and layering session data reveals the stop is also short of:
- Asia high (July 27)
- PM high (same day, July 27)
- New week opening gap — not yet delivered to
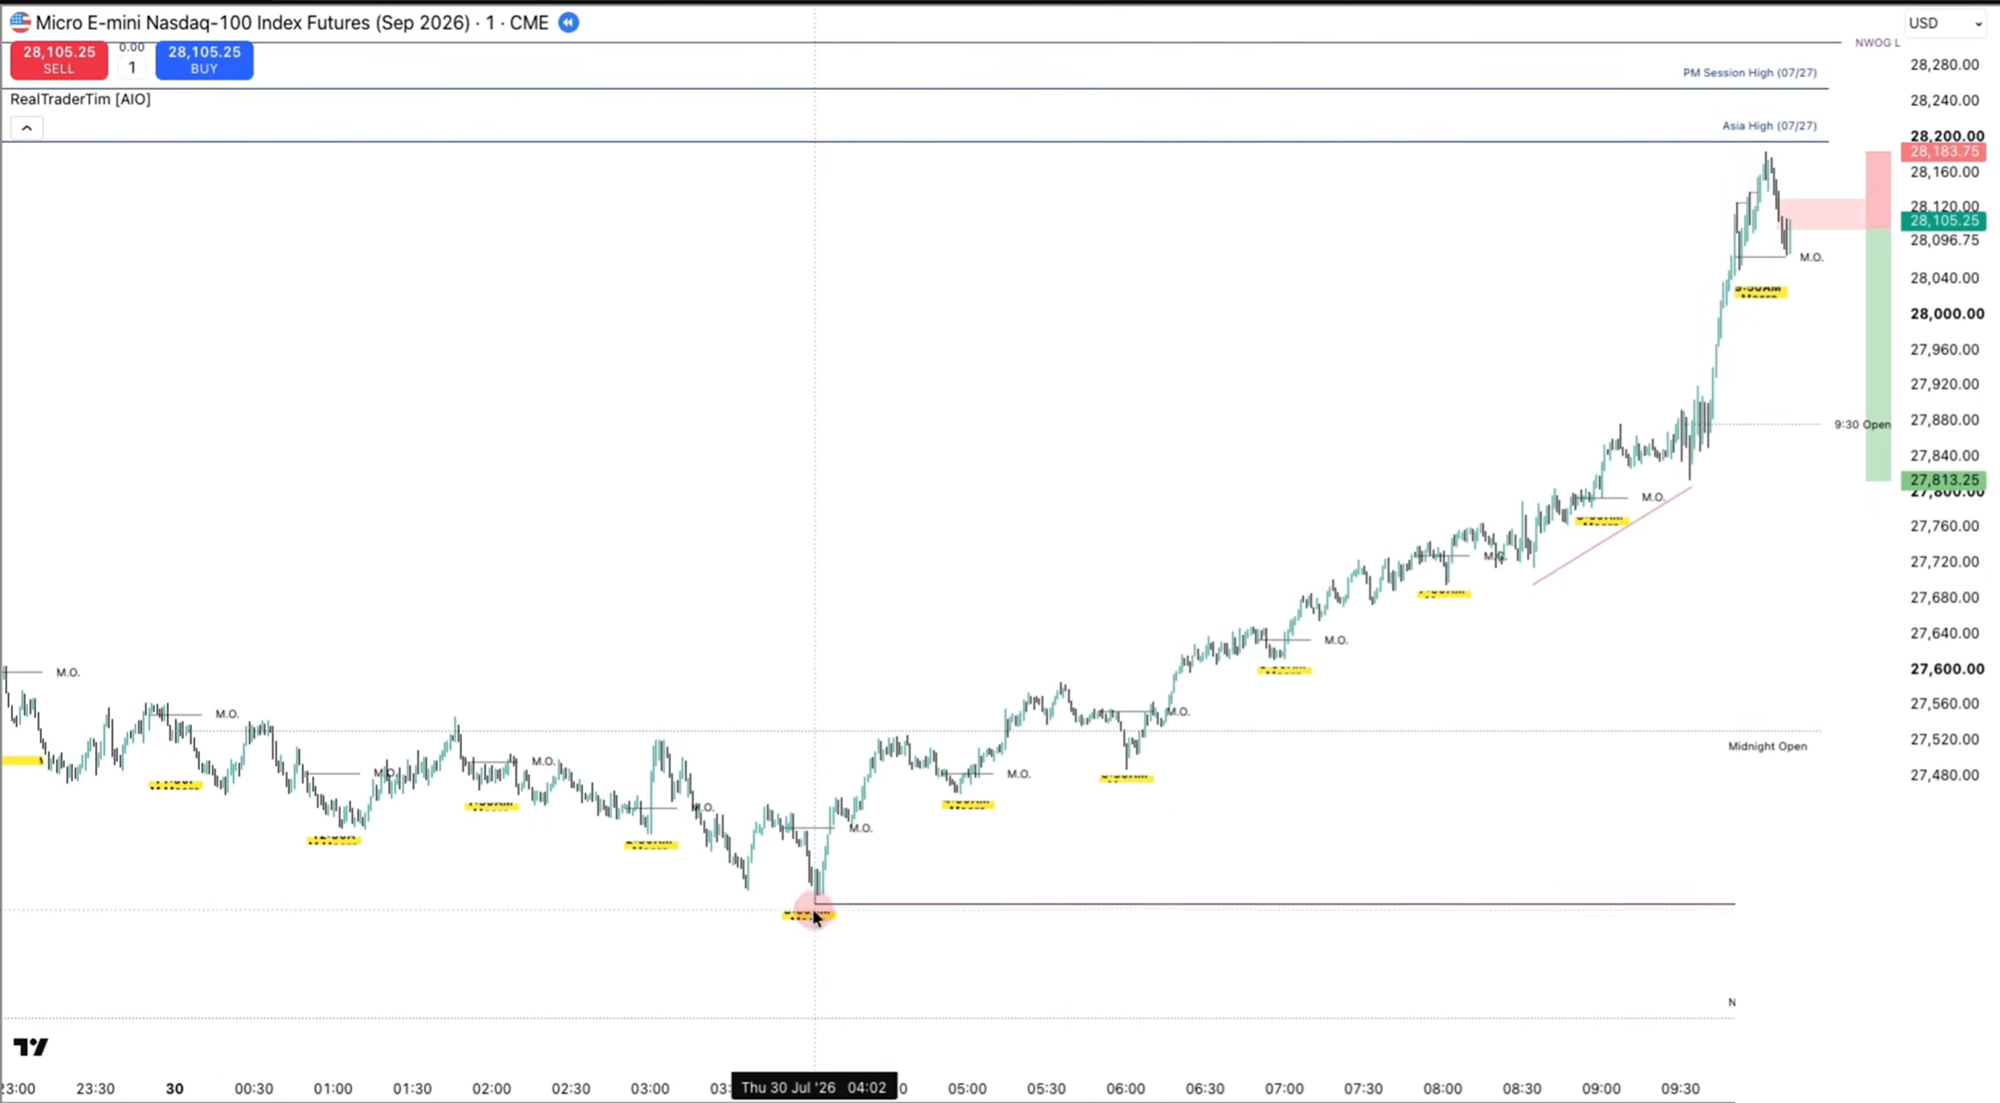
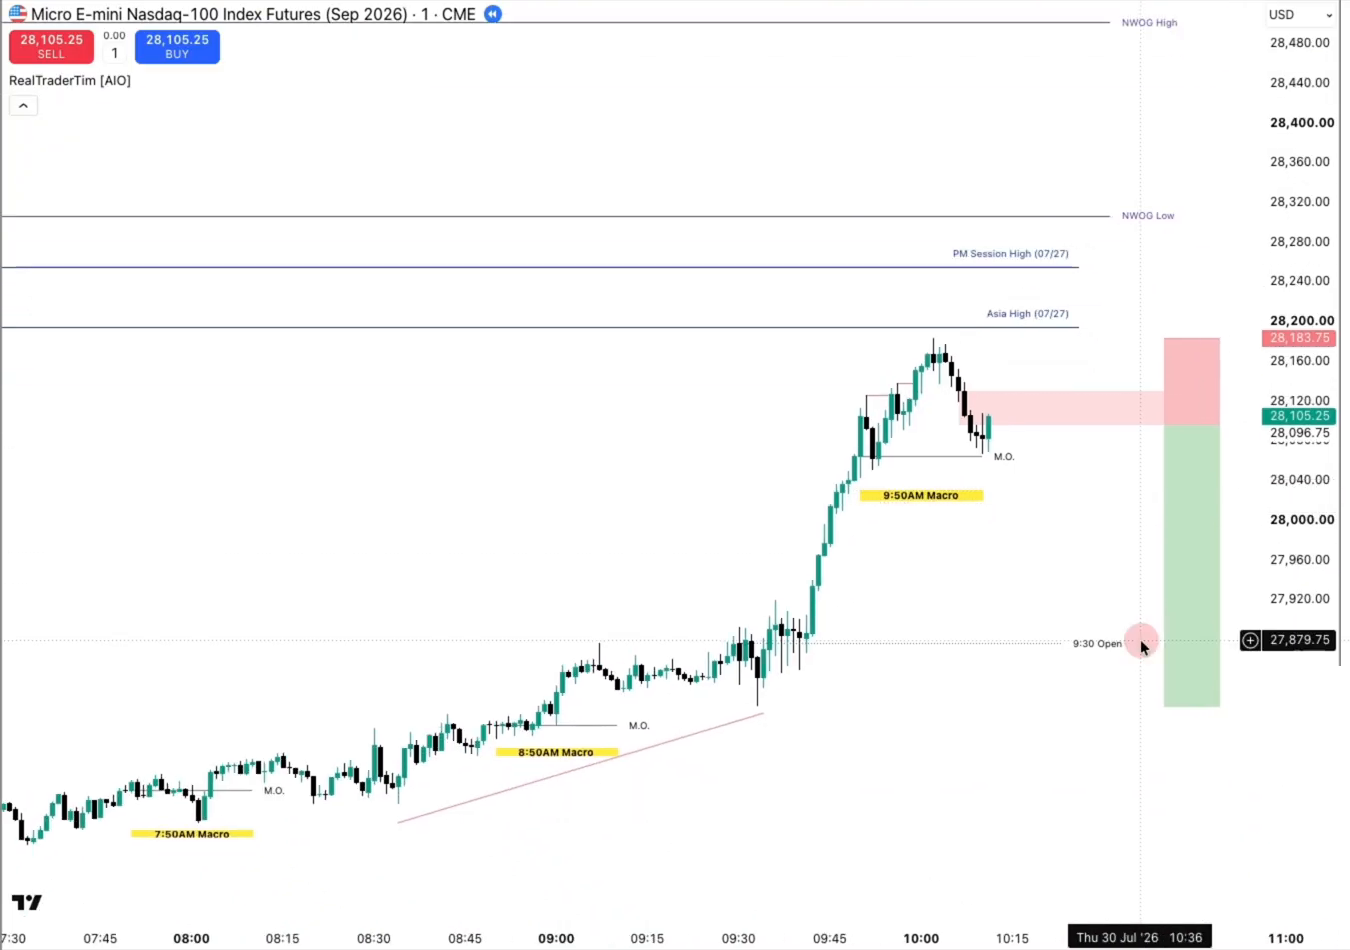
With three strong upside magnets undelivered and a stop-loss sitting just beneath a session high, this short is a low-probability, easily avoidable trade — regardless of how "clean" the bearish pattern looks on the 1-minute chart.
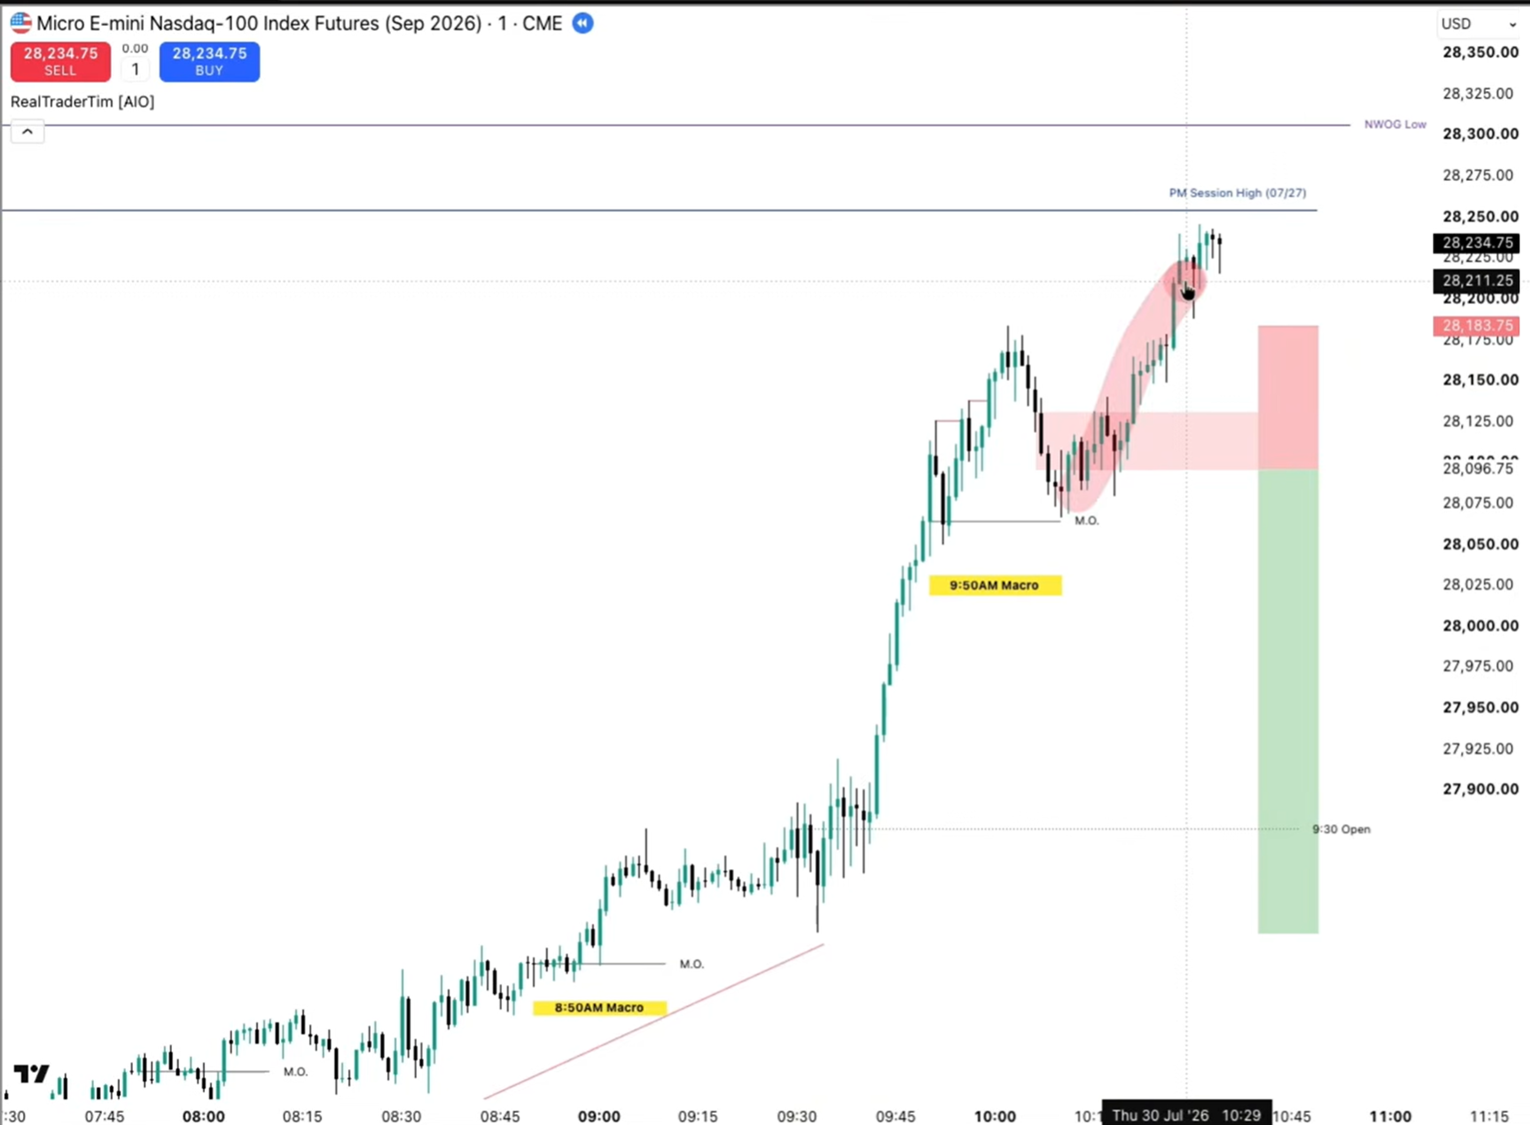
Example 2 — Avoidable Long → The Actual (High-Quality) Long (July 30)
After avoiding the short above, price trends up. Traders want to go long in line with the trend on a retracement.
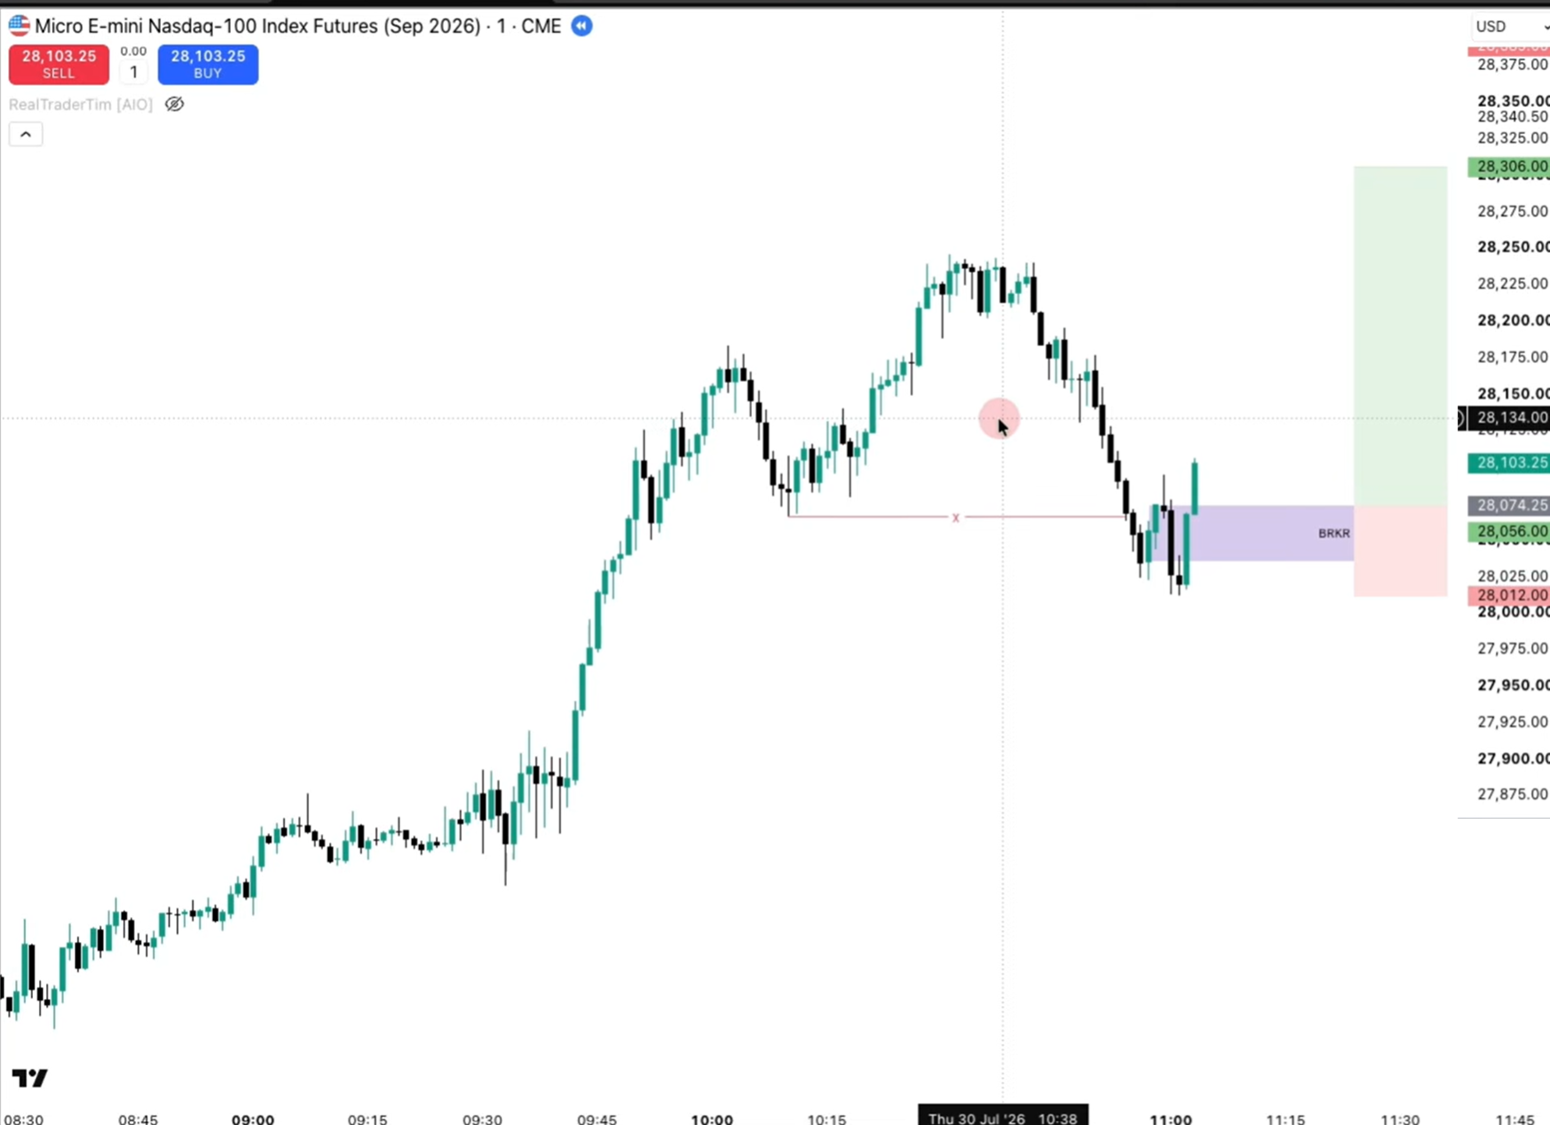
Price pulls back to discount and forms a textbook-looking bullish breaker. But the stop-loss sits just above the undelivered 9:30 first-presentation FVG.
Sneaky signature: The stop-loss is a point or so above the 9:30 opening gap, which has not yet been delivered to. That makes the low a suspect (engineered) low — likely to be swept before any real move.
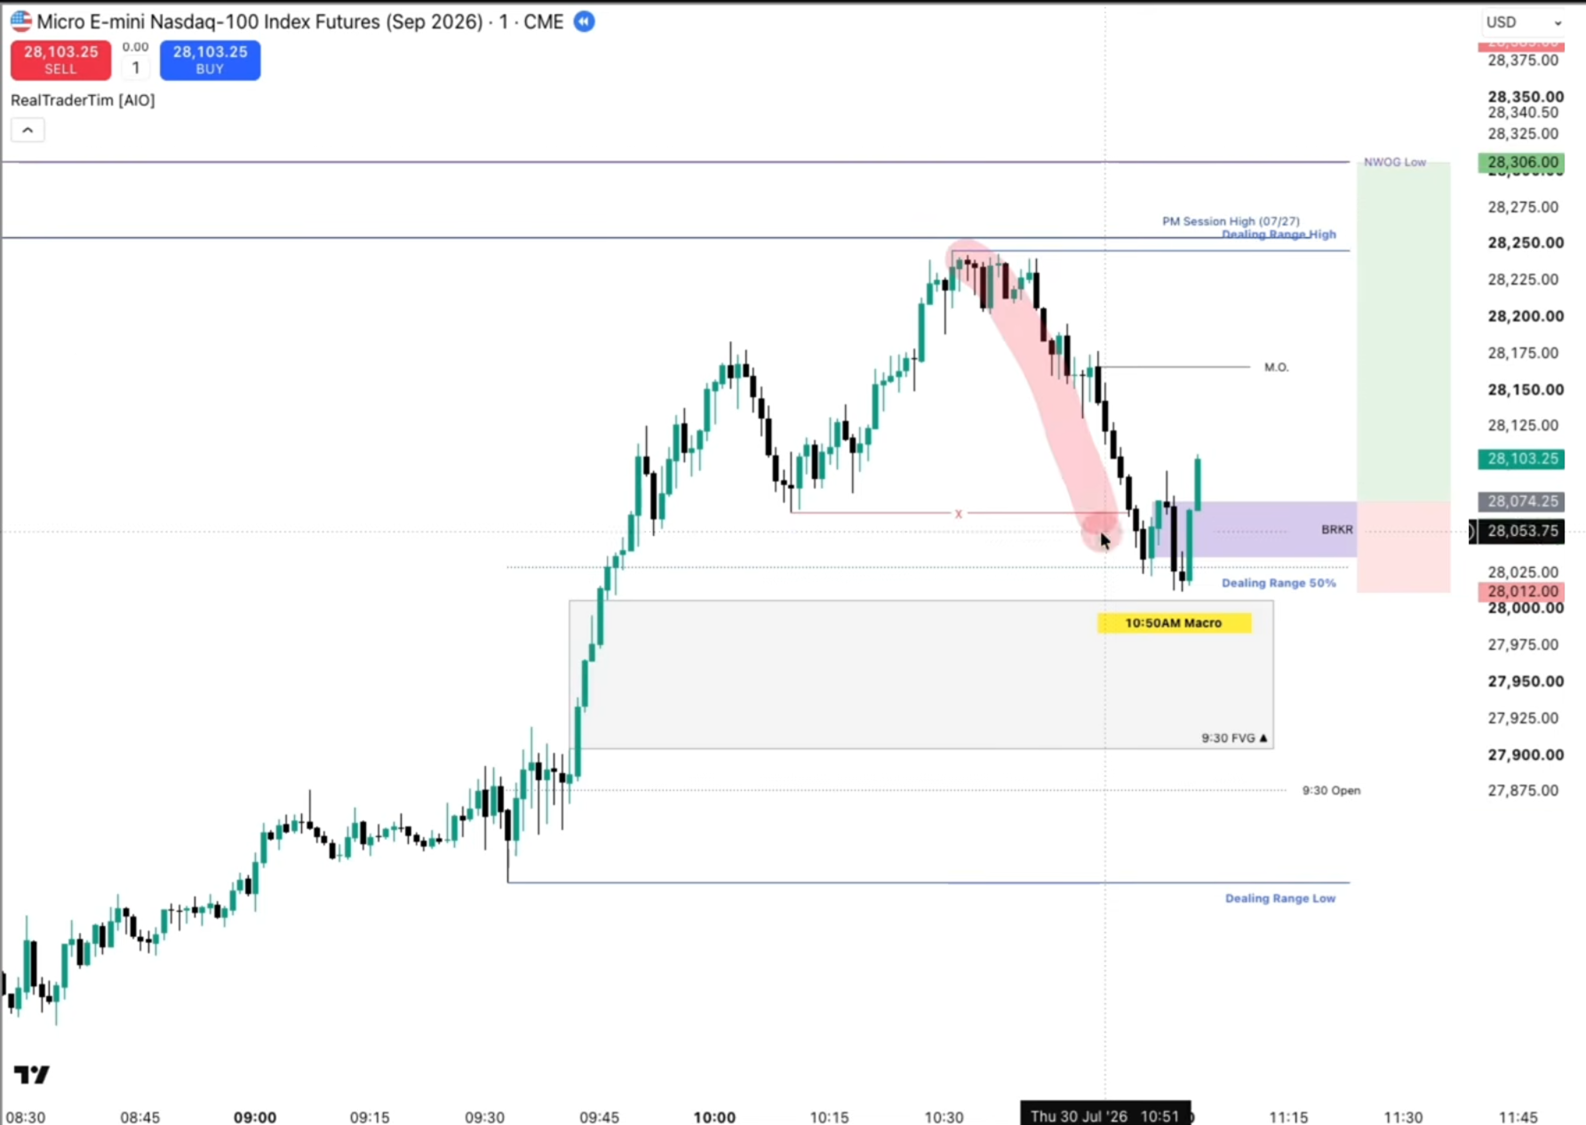
This first breaker attempt is stopped out exactly as predicted.
After the 9:30 gap is finally delivered to, a genuine breaker forms — now backed by both discount pricing and a completed sweep into the 9:30 FVG.
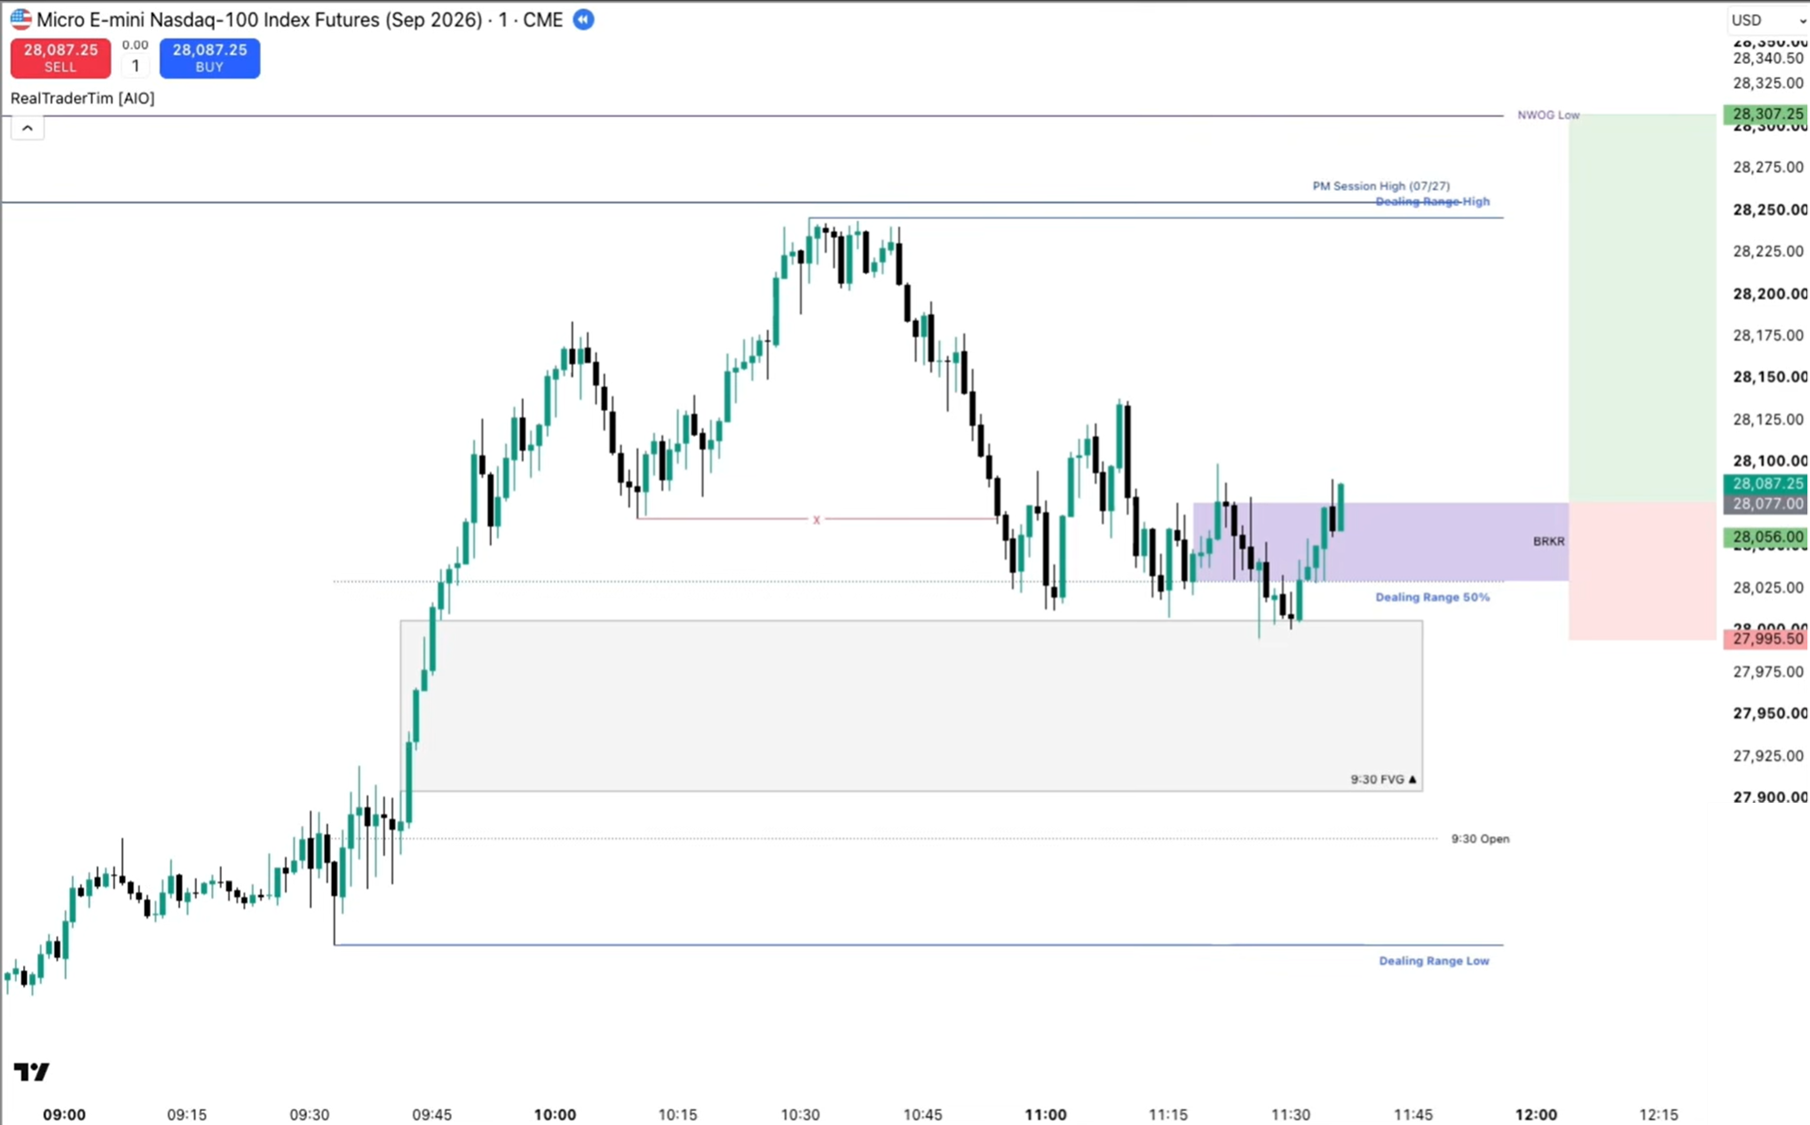
Price grinds up toward the AM high / session high, with session highs from July 27 (PM high, new week opening gap) all aligning in the same direction — reinforcing the long bias.
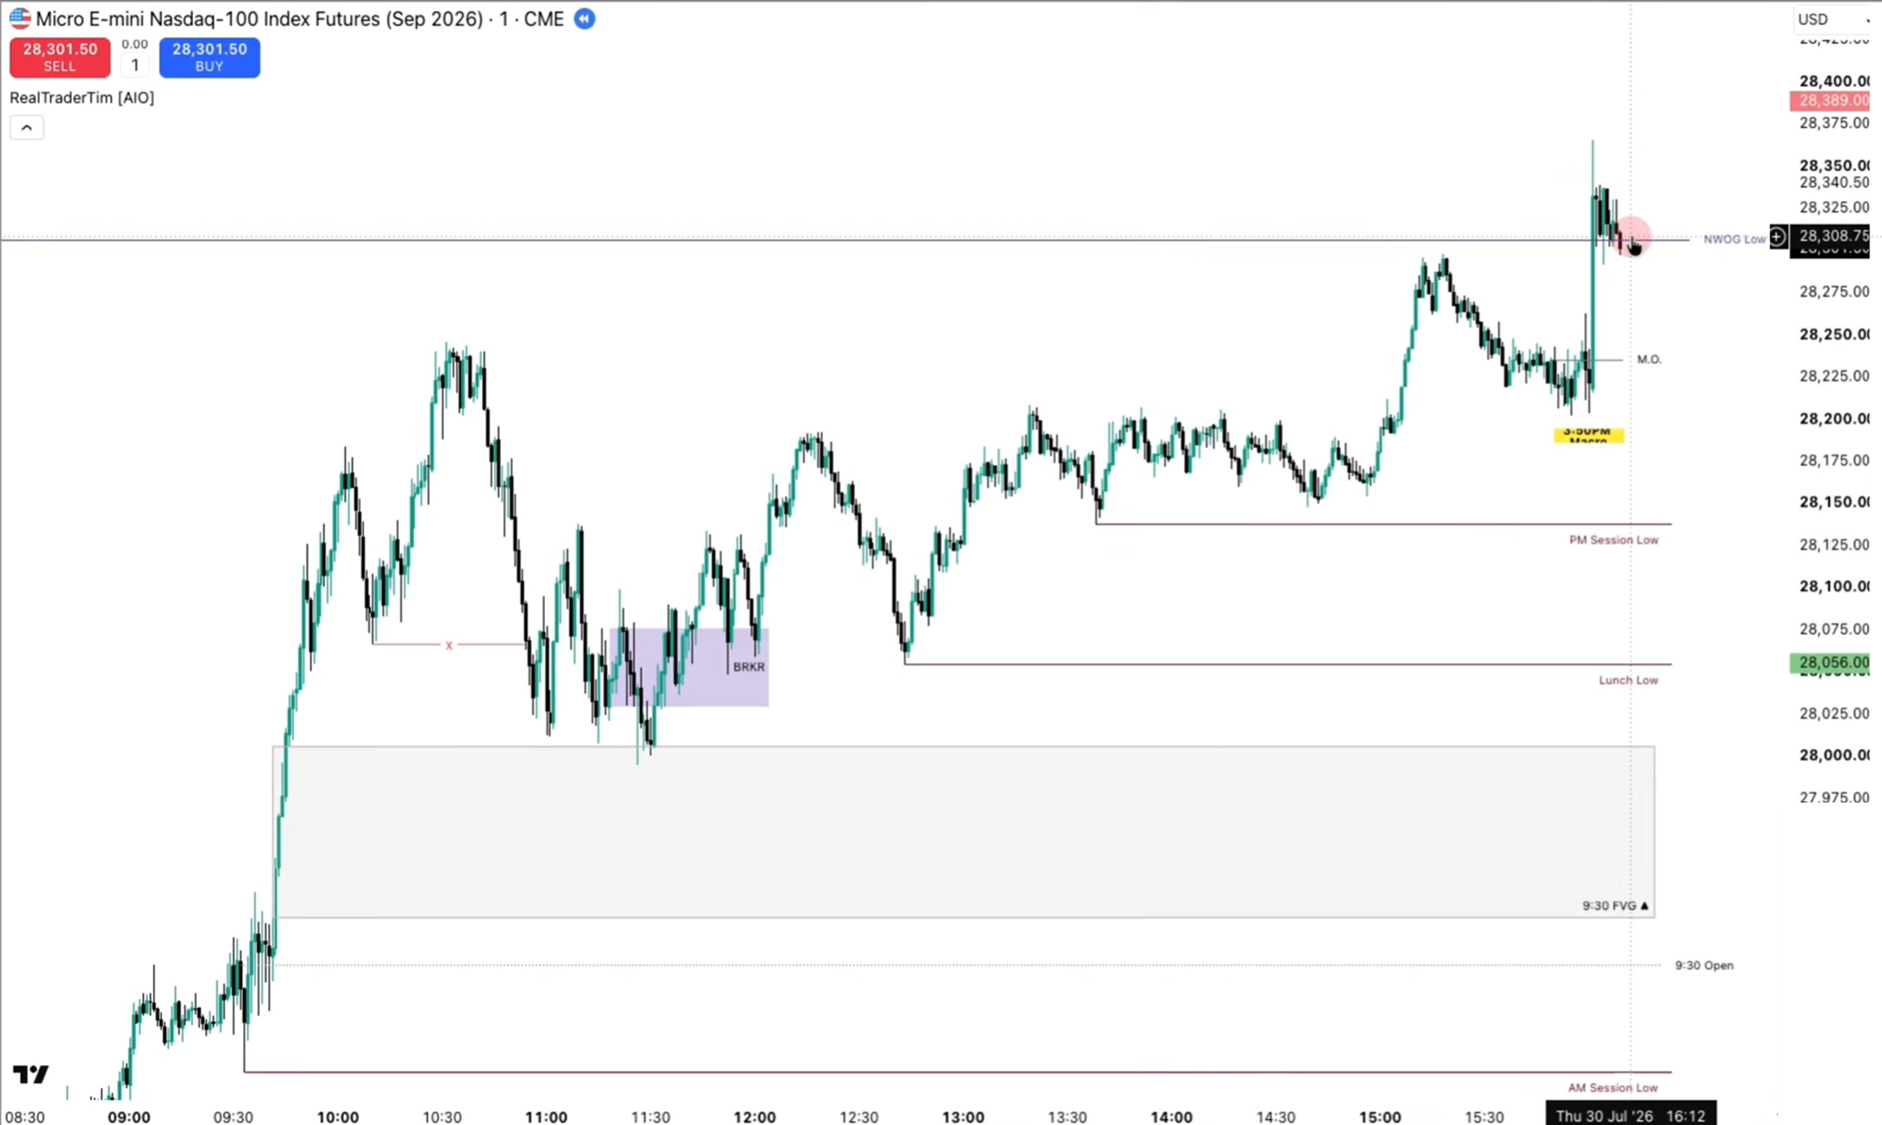
Lesson: Same pattern (breaker), same general trend bias — but the first instance had a bad stop-loss location and the second didn't. All focus should go to the setup with "nothing wrong with it."
Example 3 — Key Opening Price + Session Low Trap (July 21)
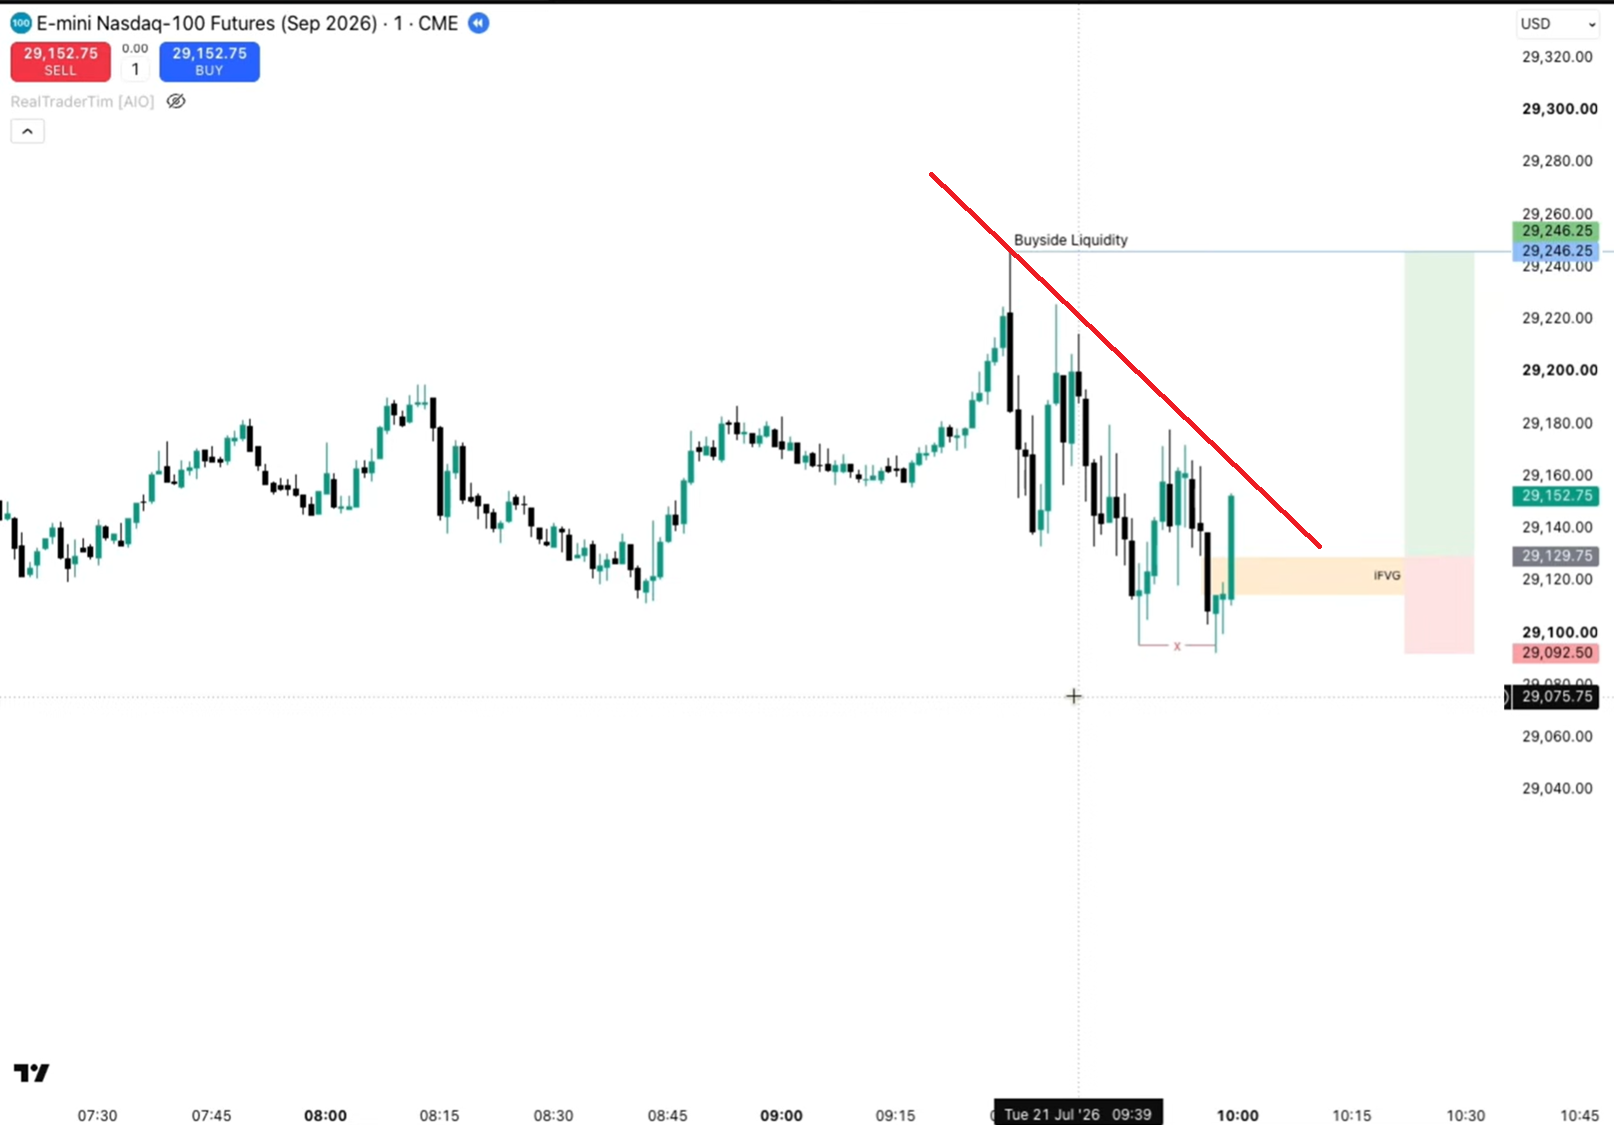
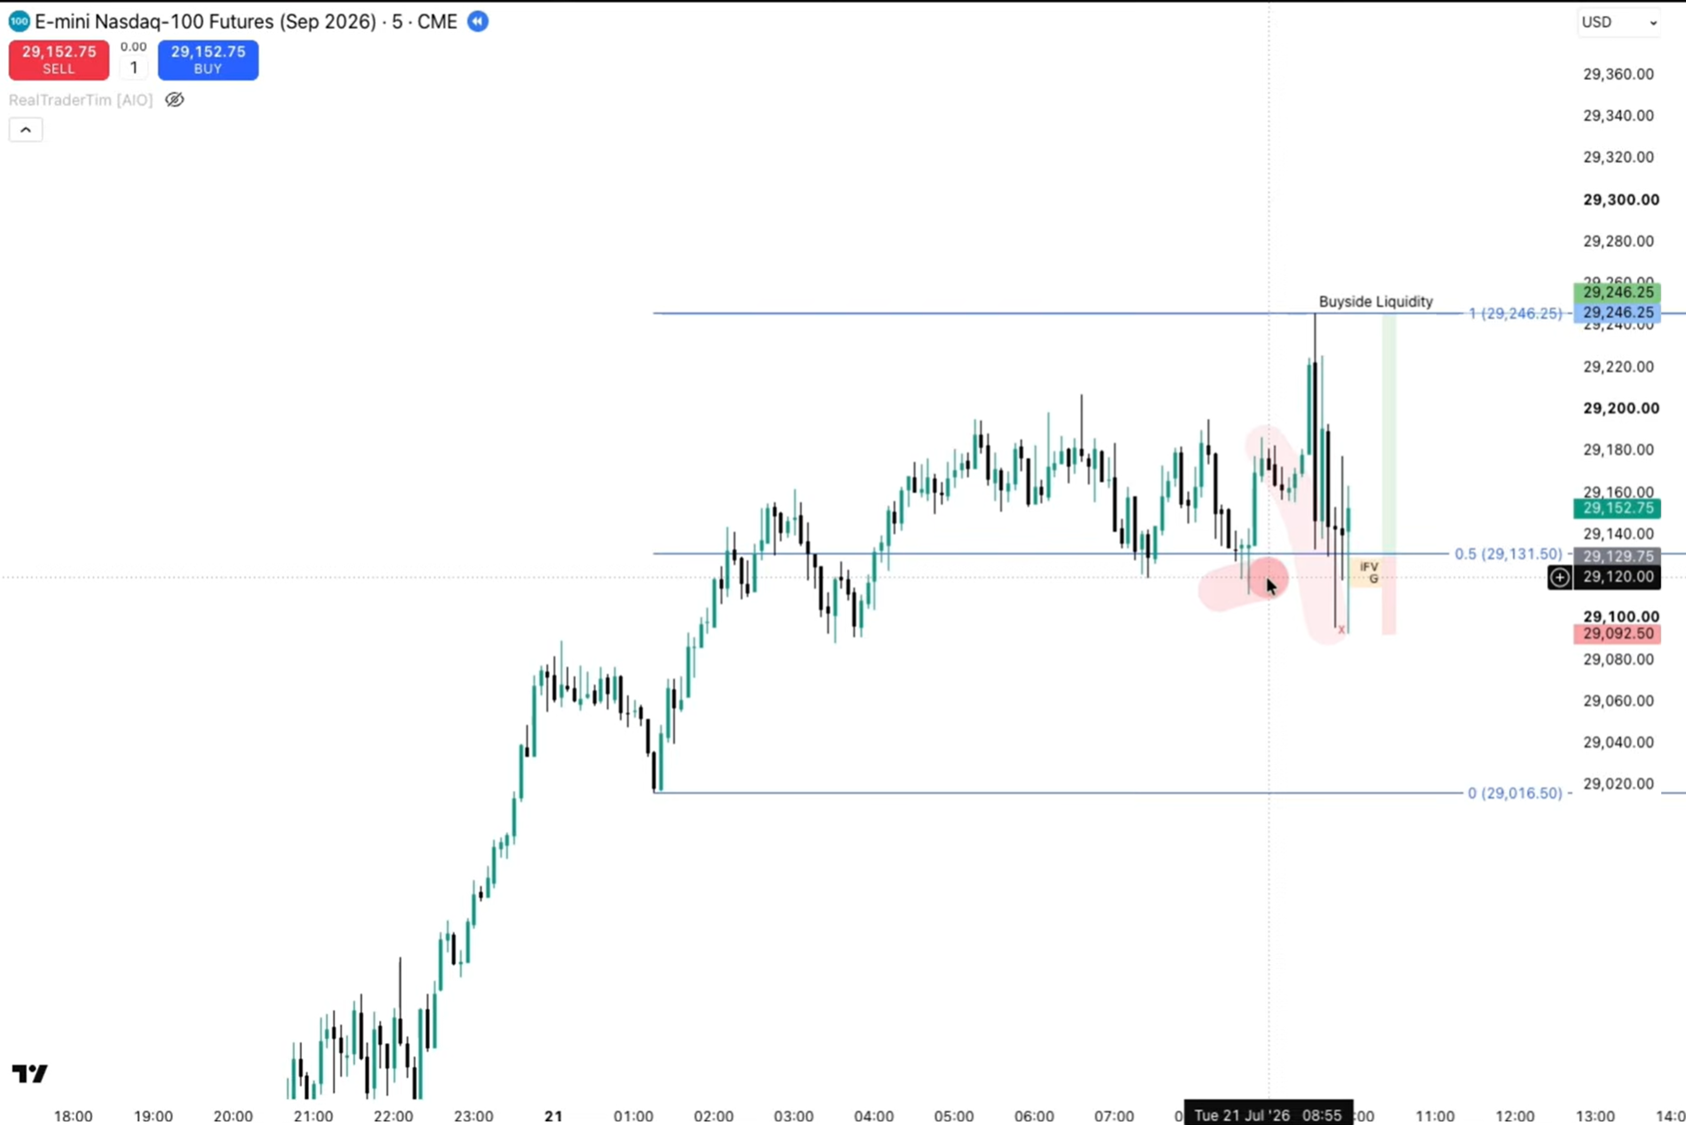
Key 9:30am opening price act as a strong magnet. Clean trendline highs on the 1-minute chart. Zooming to the 5-minute chart shows price is in a discount of the broader range after a sweep — seemingly time to go long.
A sweep followed by a close above a bearish FVG forms a textbook-looking inversion FVG long.
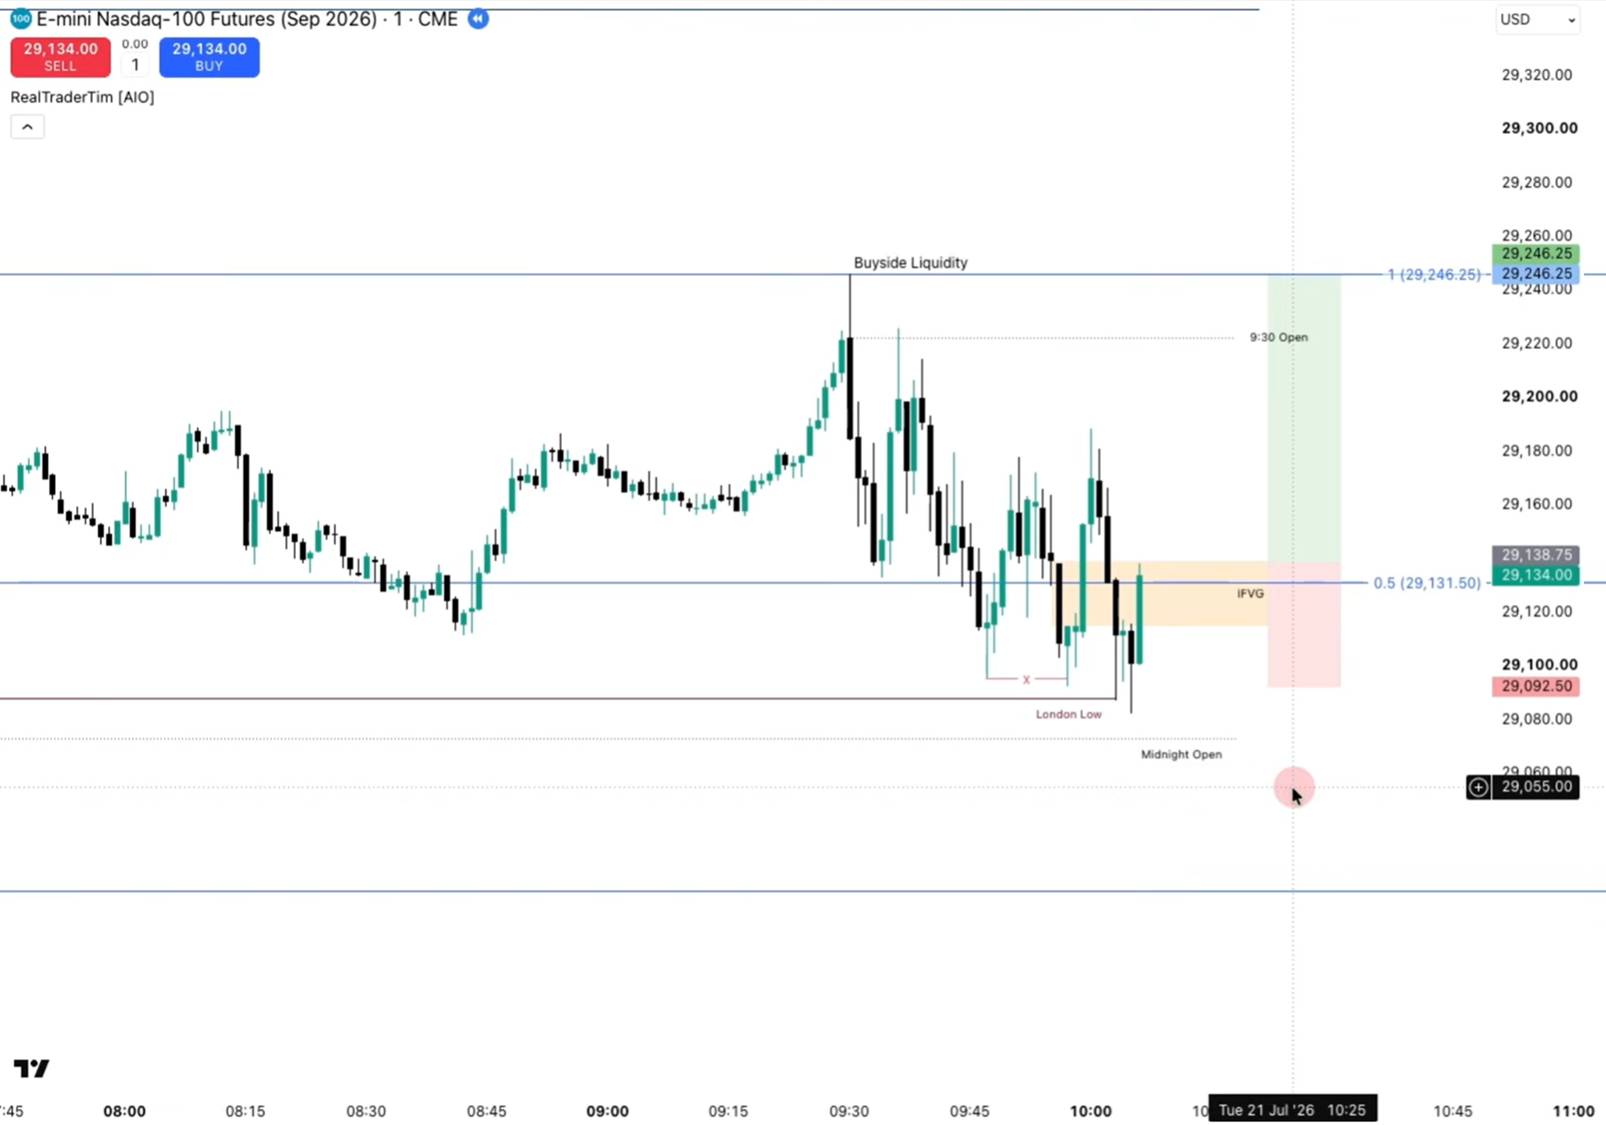
The stop-loss for this inversion trade sits just above London low (29,088) — and midnight open sits right below that too.
This setup fails. Price runs through London low and midnight open before reacting.
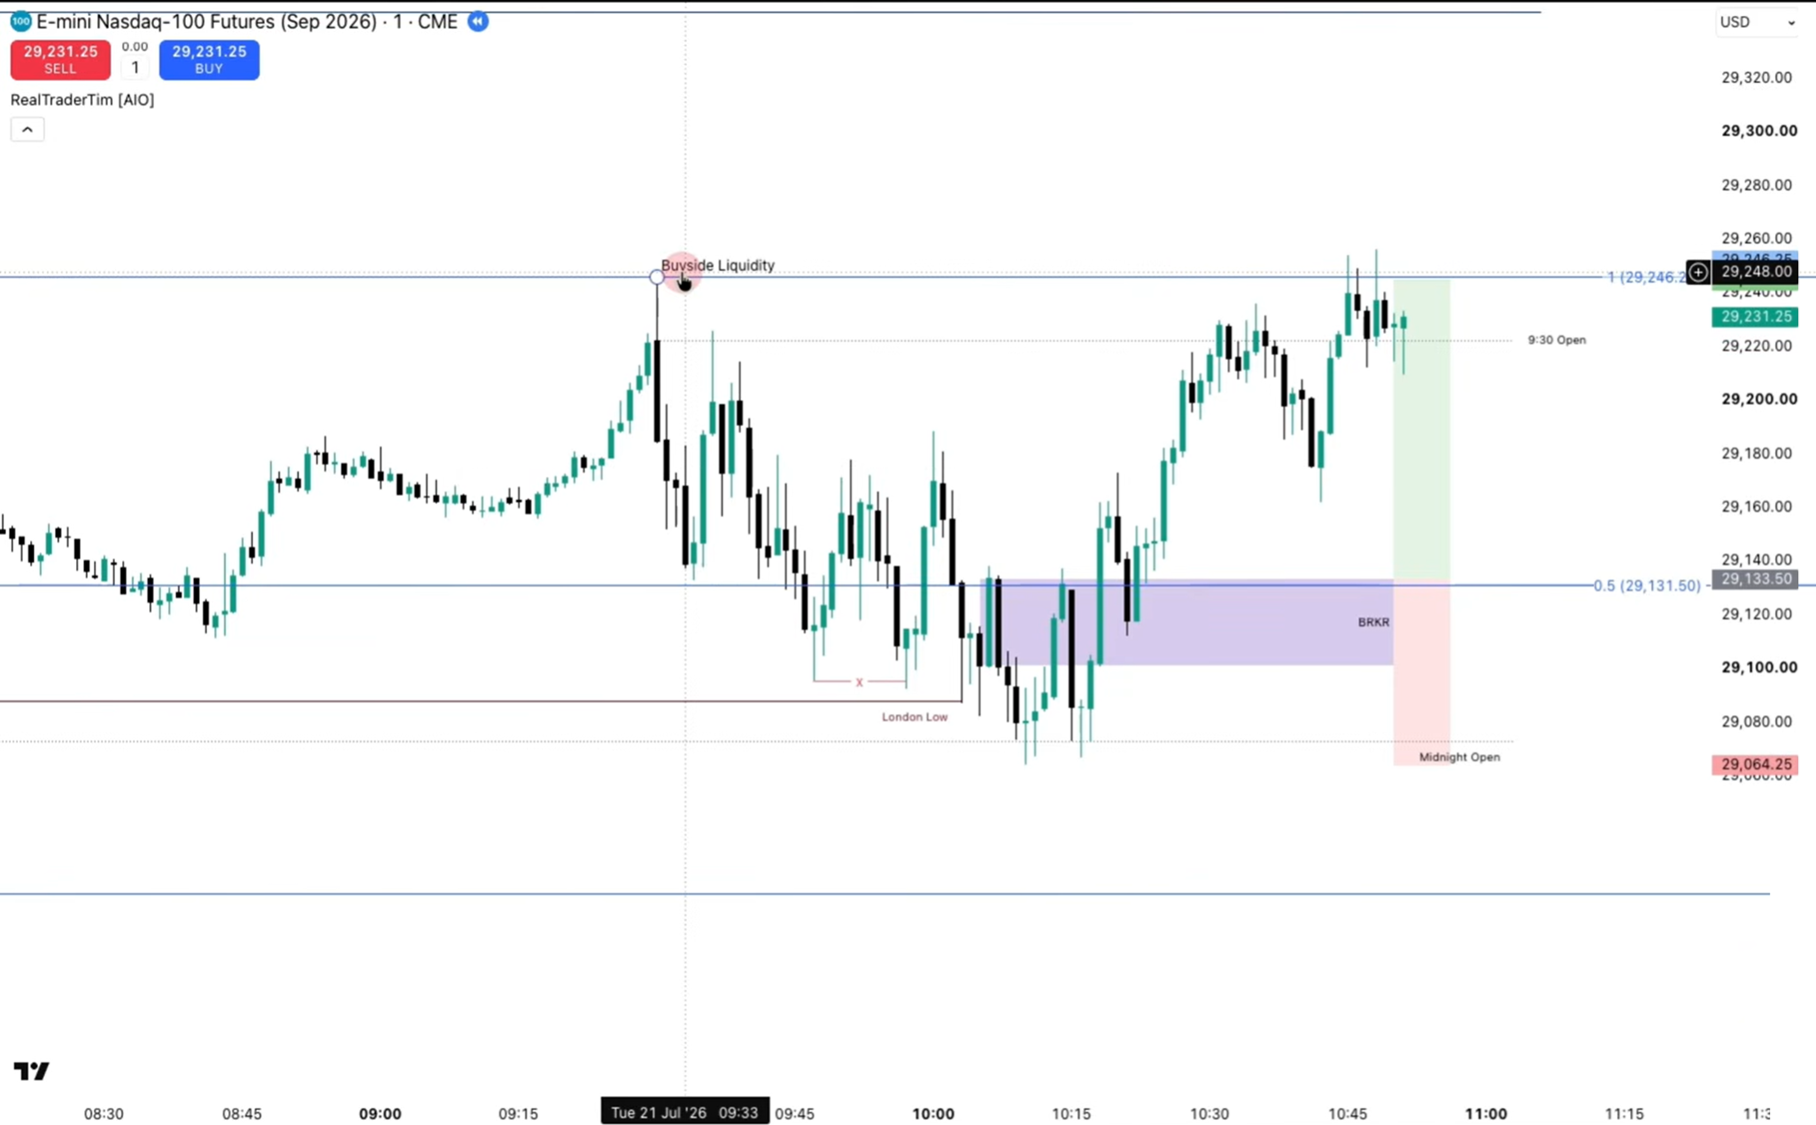
After London low and midnight open are both swept, a new breaker/inversion setup forms in a genuine discount — now the pattern is "much more favorable," in Tim's words, and the trade should be taken.
Lesson: Pass on the low-quality setup in favor of waiting for the higher-quality one. Once the concerning levels are cleared, the exact pattern preference (breaker vs. IFVG) becomes secondary.
Example 4 — New Day Opening Gap (NDOG) Short (July 23)
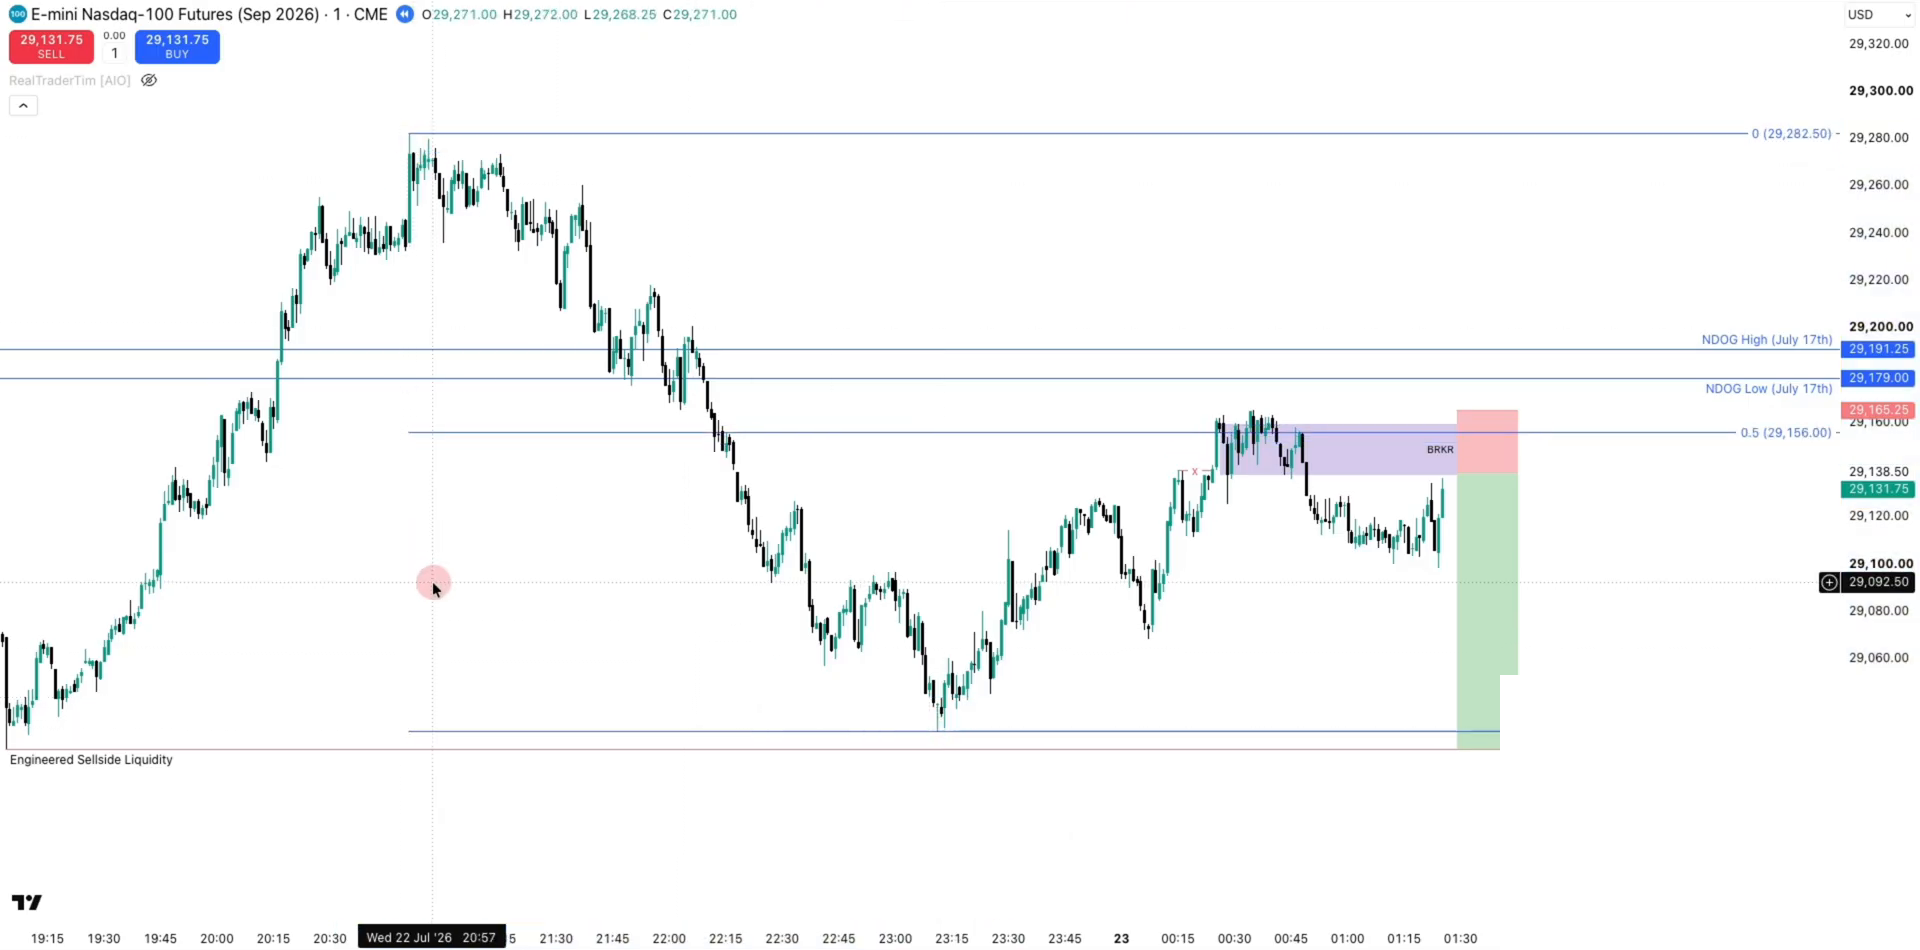
This example emphasizes tracking previous new day opening gaps, not just the current day's. A previous NDOG from July 17 (high and low) is still unfilled and plotted on the current (July 23) session.
Price forms a high-high-low-higher-high structure — a textbook-looking bearish breaker on the close, trading in line with a downtrend and into premium (relative to equilibrium), with relative equal lows nearby.
The stop-loss for this short sits just below another (unfilled) new day opening gap.
Stopped out.
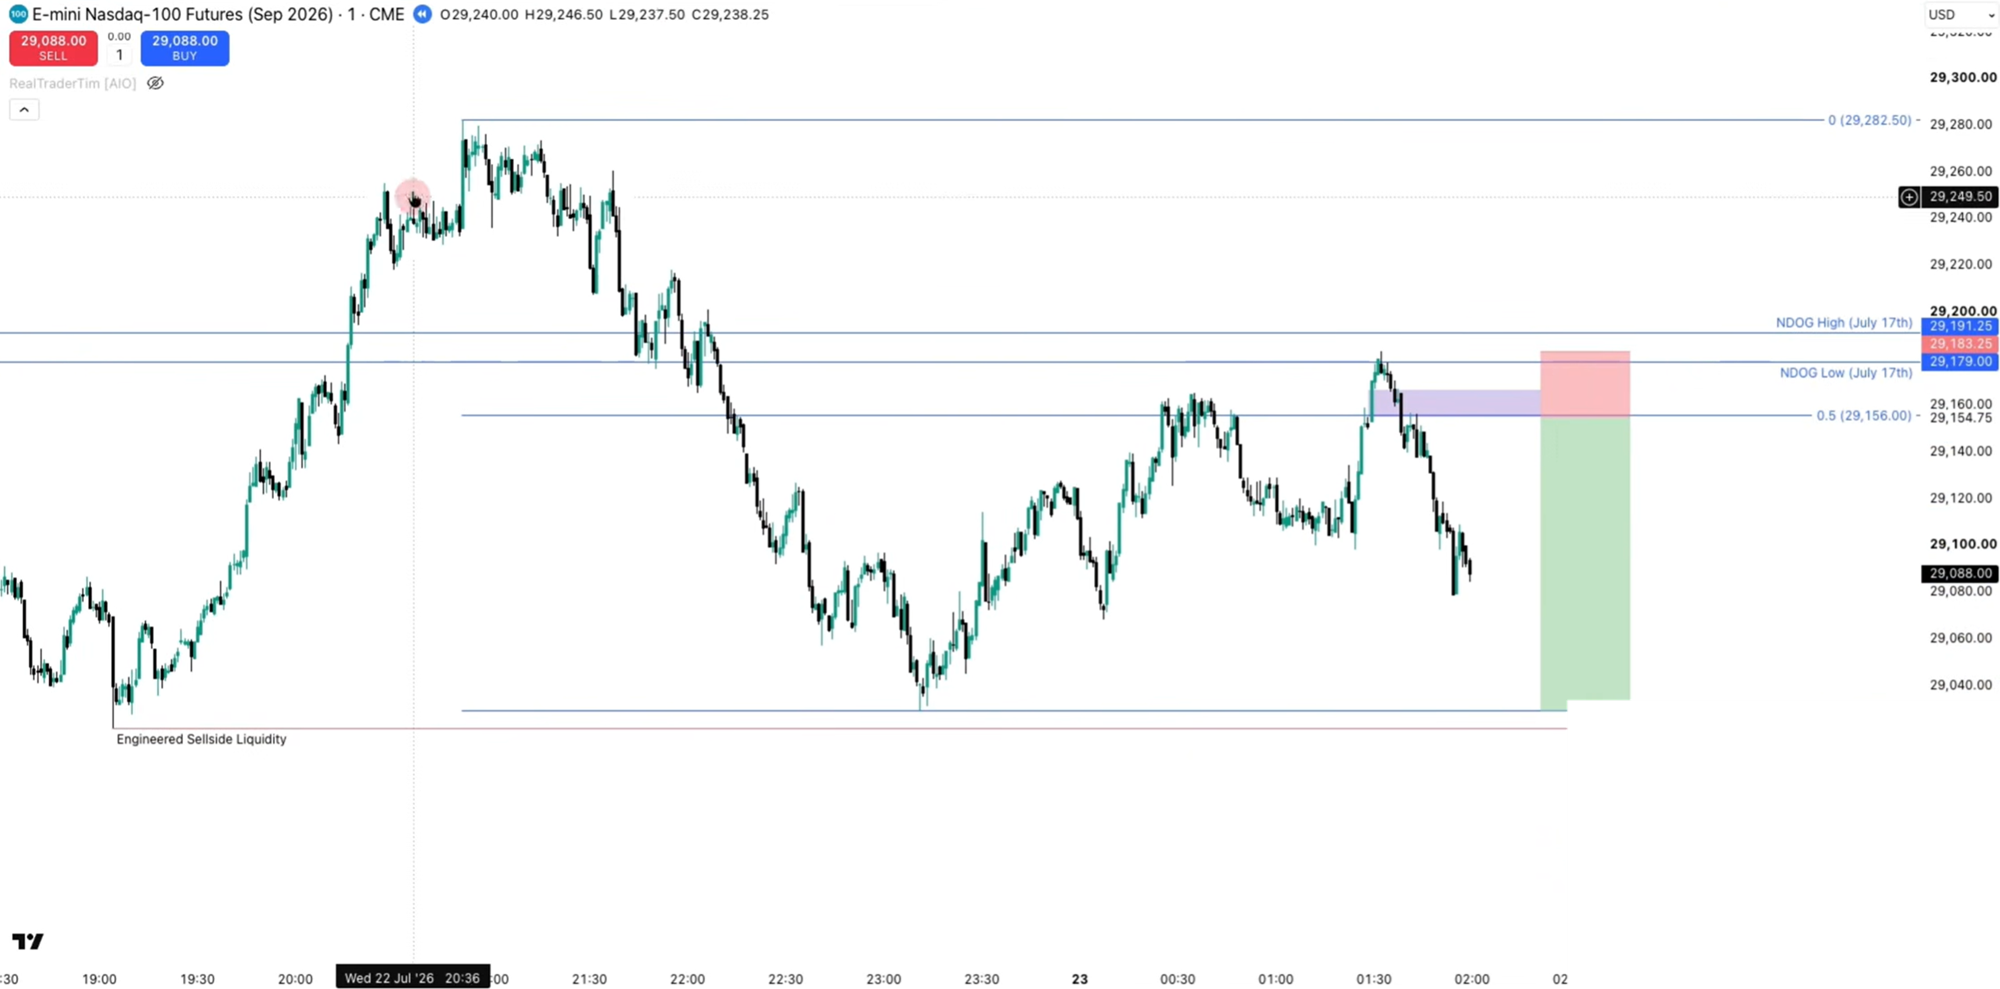
Once price actually taps and respects/rejects the new day opening gap, a genuine inversion FVG short forms — same premium positioning as before, but now the key level has actually been delivered to first.
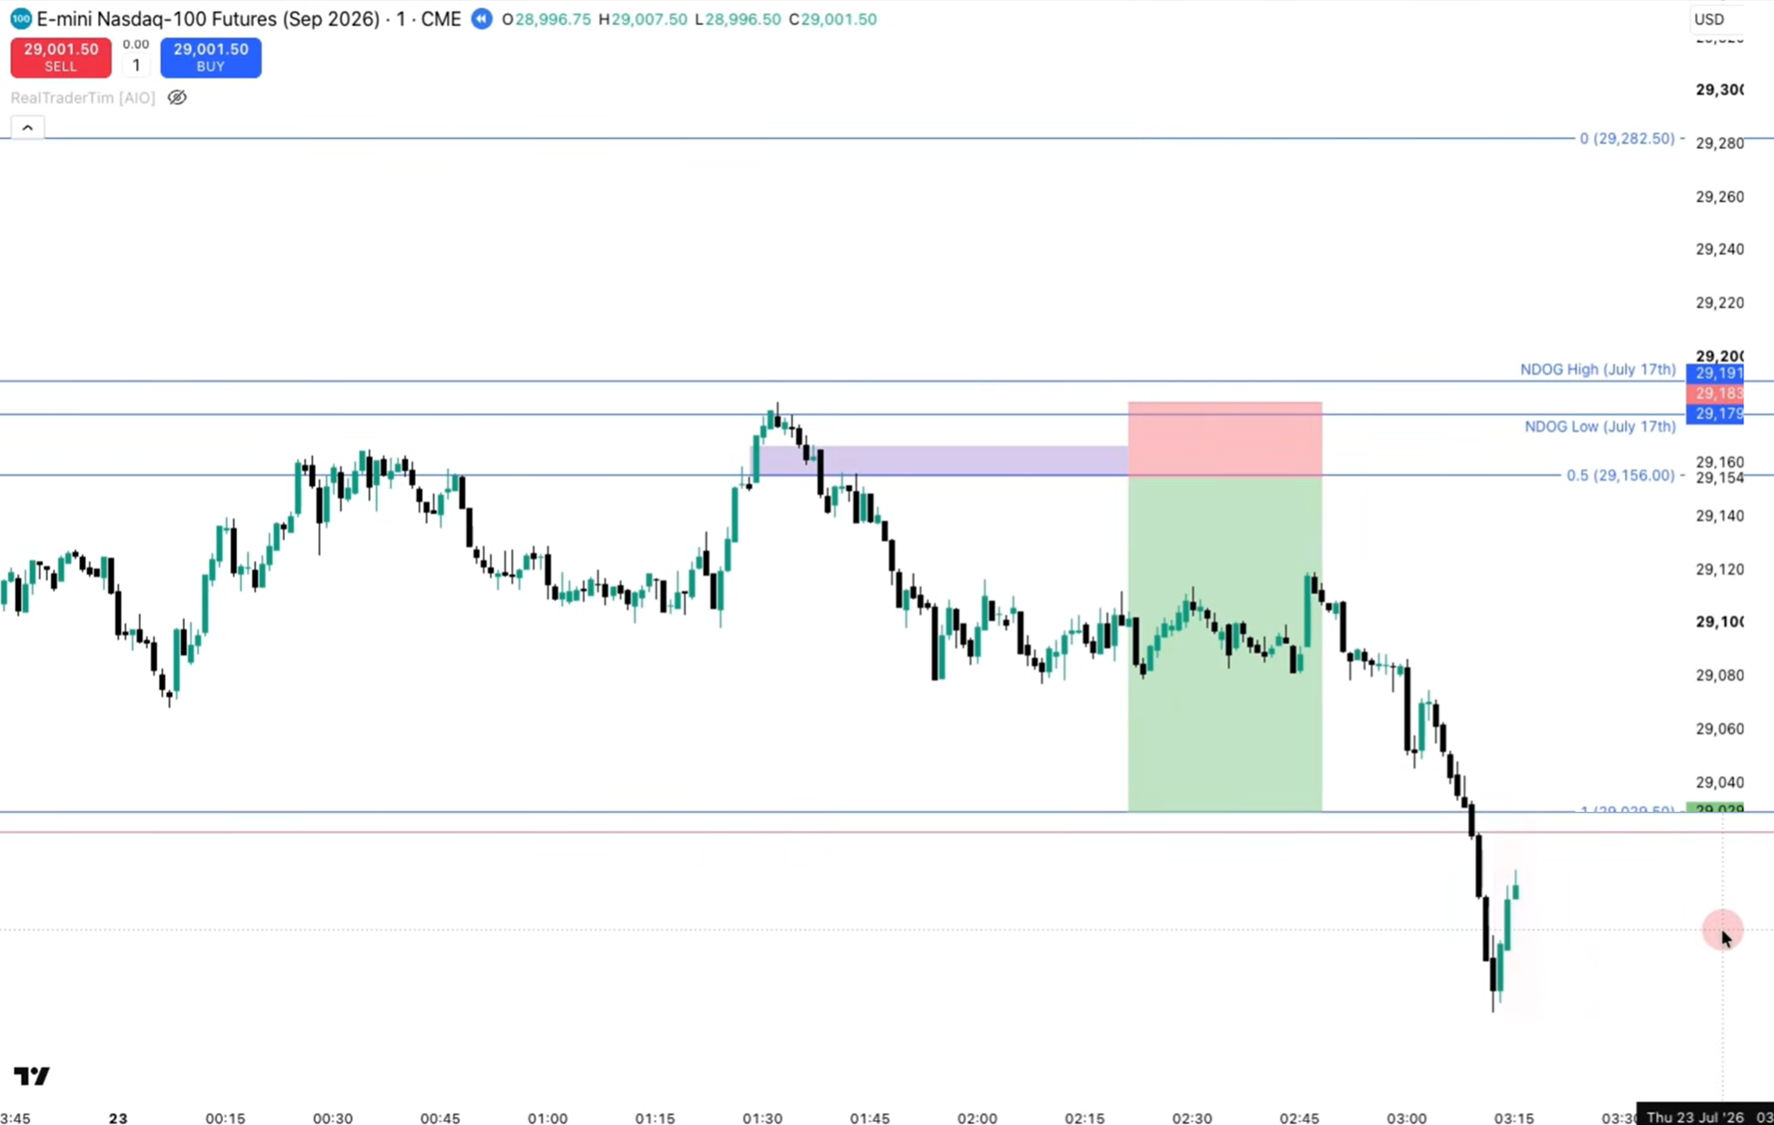
Lesson: Always check for nearby untapped key levels (including previous NDOGs) before taking a lower-timeframe pattern trade.
Example 5 — The Equilibrium (EQ) Favorite Setup
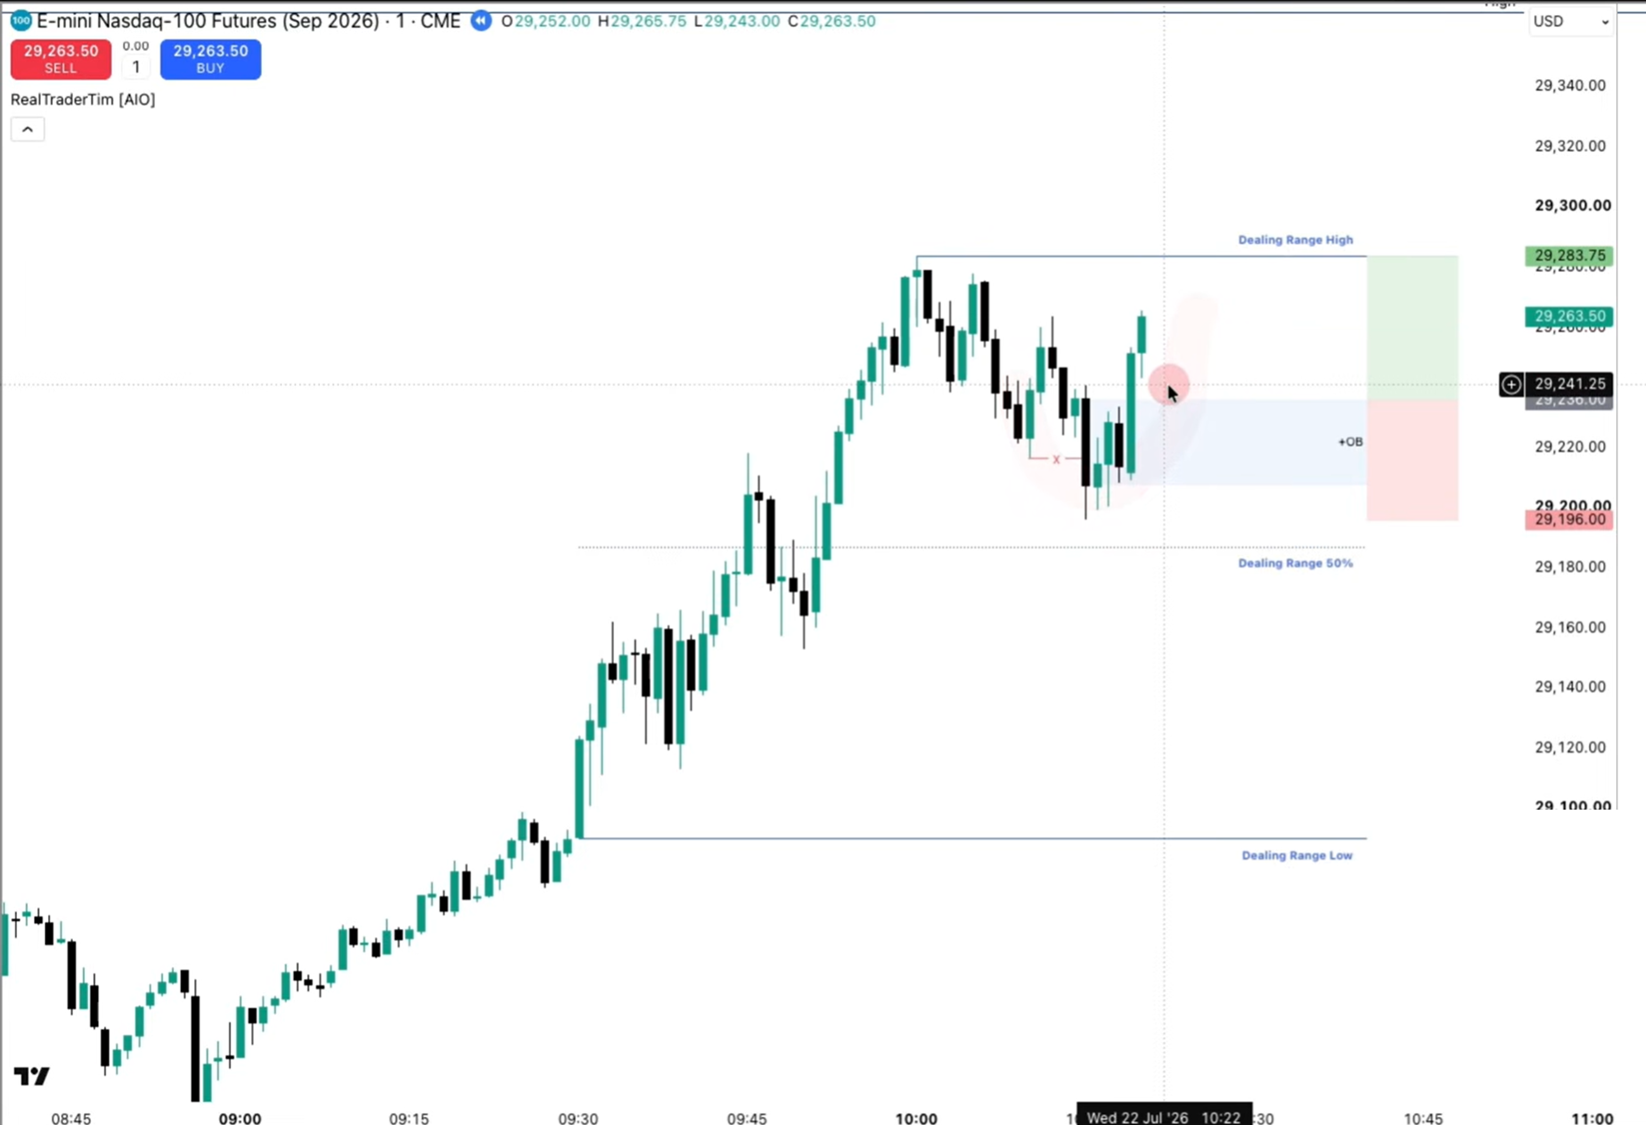
A clear uptrend where the dealing range (9:30 low to session high) defines an EQ (equilibrium) level. Described as one of Tim's favorite signatures.
An order block / breaker retracement forms, but the swing low used as the stop sits just above discount / EQ — meaning price hasn't truly proven a discount yet.
As expected, this setup is more likely to fail.
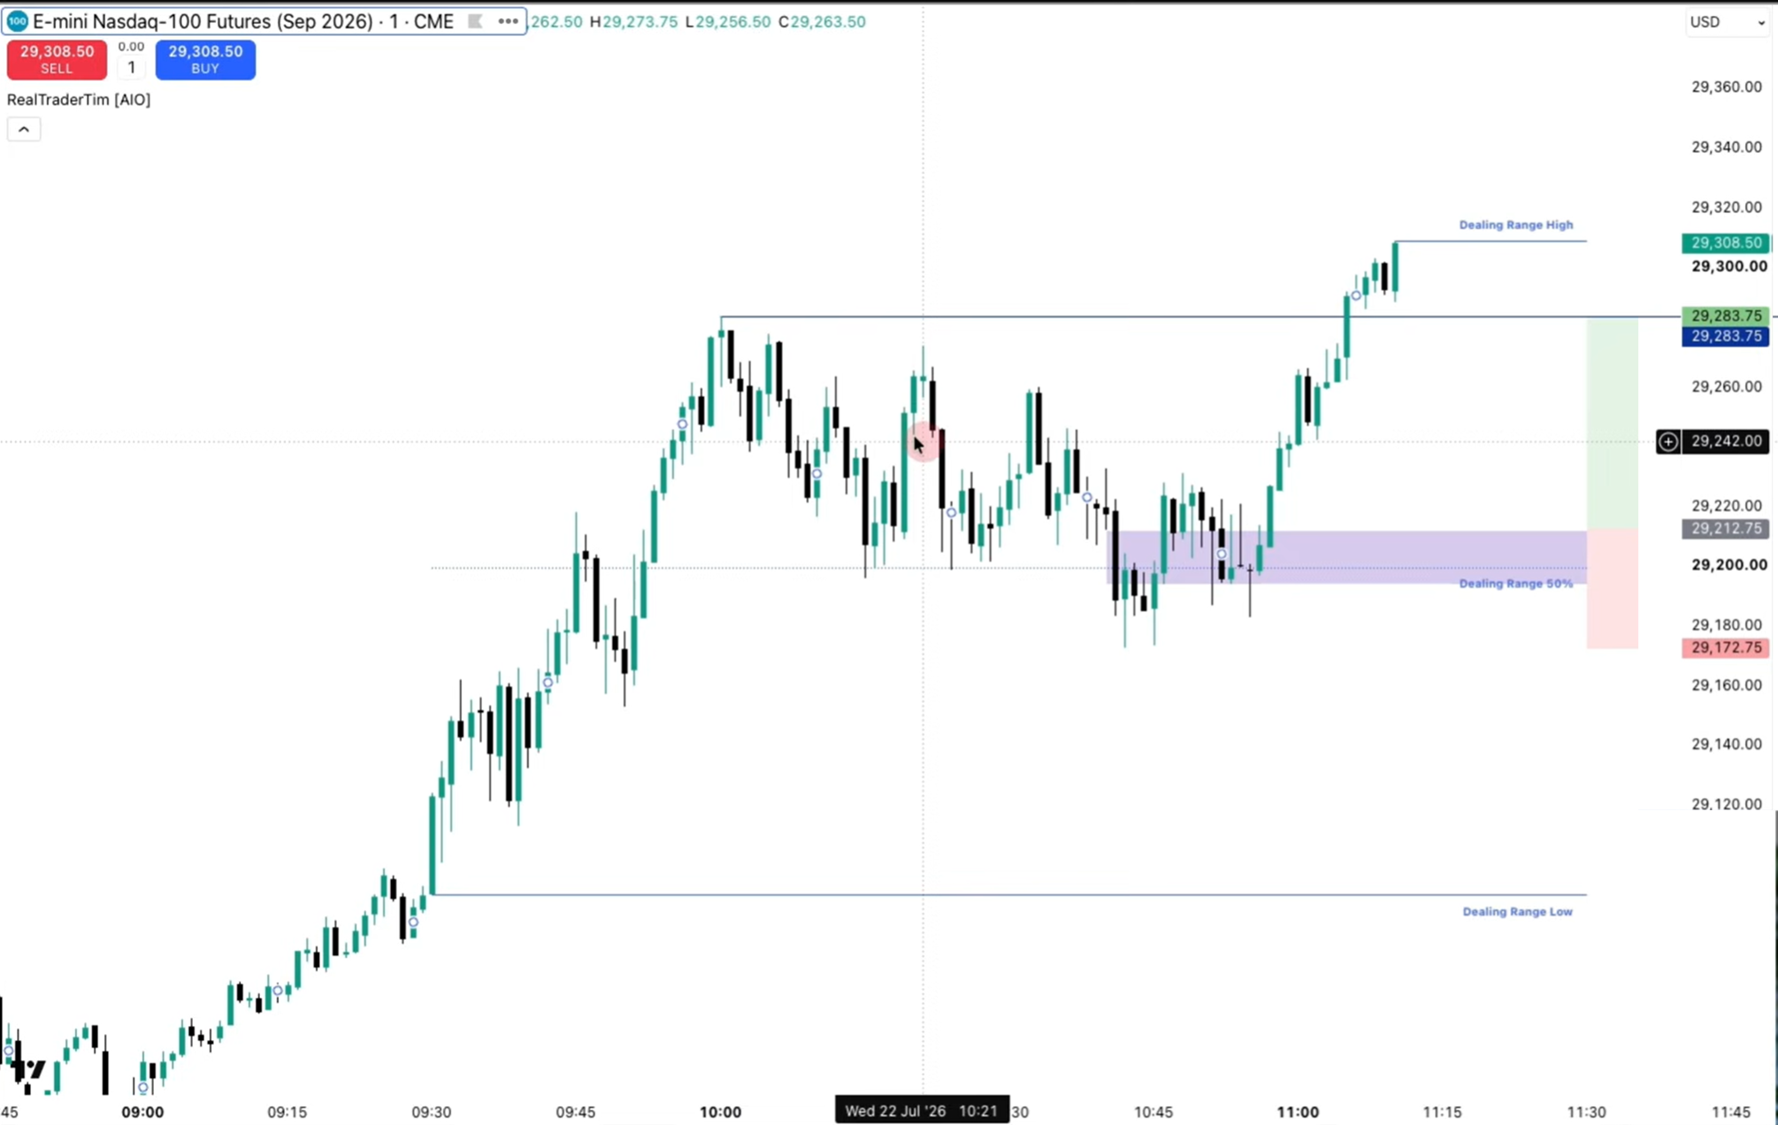
Price continues down into a genuine discount, sweeping the prior lows. A balanced price range (BPR) forms, and the long is taken with a stop below the swing low — now the true invalidation point, because discount has actually been reached and the lows have actually been run. This fits the higher-timeframe narrative with no LTF concerns left.
With the trade now trading in line with the trend, out of a real discount, and with the lower-timeframe signature resolved, the inversion/BPR pattern becomes far more favorable than the earlier order block or breaker attempt.